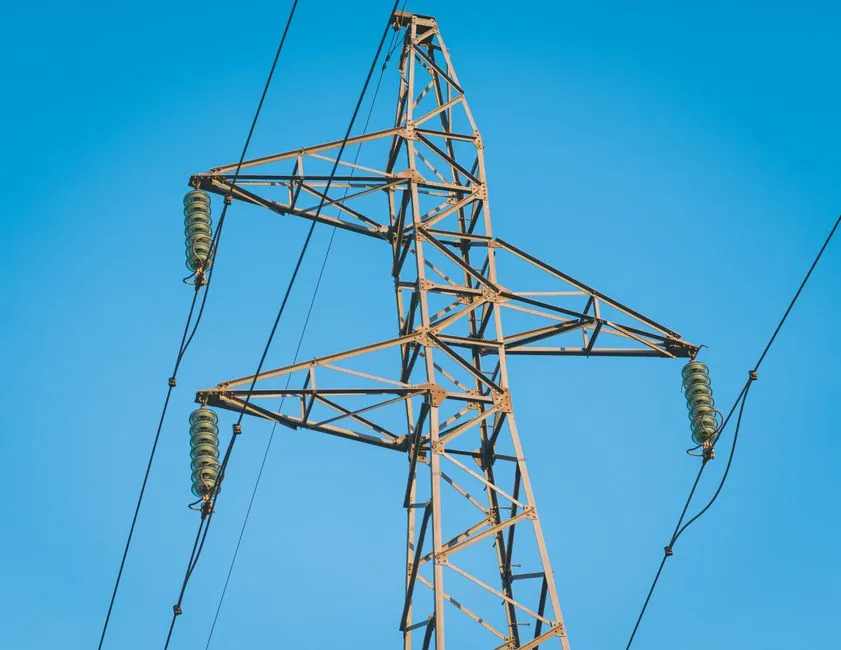
Grid build-out, EV manufacturing, and AI data center buildout are now the three competing copper sinks of the 2026 cycle, and the IEA's most ambitious scenario projects up to 48% additional copper demand globally by 2040 versus current consumption of roughly 28 million metric tons [S3][S7].
Price action confirms the tightness: LME copper sat near $13,000 per metric ton in early January 2026, capping a 40% annual gain through 2025 driven by supply disruption and structural electrification demand [S4]. For process engineers, the relevant question is not whether the metal runs short, but where the marginal ton goes first: into grid conductors and transformer windings, into EV traction wiring and battery interconnects, or into hyperscale data center bus and grounding.
Where the demand split sits in 2026
Grids and electrified transport are the two dominant copper sinks in IEA's announced-pledges and net-zero scenarios, together approaching roughly 50% of total copper demand by 2040 [S3]. An average battery EV uses 3-4x the copper of a comparable internal-combustion vehicle, the bulk of it in the stator and rotor windings of the traction motor, the high-voltage busbars, the charging inlet harness, and the DC link capacitor leads.
Grid copper intensity runs through four distinct sub-markets, each with its own specification: overhead transmission conductor (ACSR, AAAC, or copper-clad for high-current river crossings), distribution transformer windings (typically Cu-ETP or Cu-OF grade), switchgear busbars, and substation grounding grids. The Copper Development Association notes that conductor resistivity directly drives I²R loss in T&D systems, which is why utilities continue to specify copper for retrofit and high-density urban feeders even where aluminum is acceptable at the marginal cost point [S5].
Grids: the slow-burning baseline sink
U.S. utilities are now managing increasing load densities and more complex consumption patterns after a long period of flat demand, with large data center campuses approaching gigawatt-scale draw and individual facilities commonly requiring dedicated substations [S5]. This is a real engineering driver, not a forecast: a single hyperscale data center of 100-300 MW continuous load, including power distribution, cooling, backup generation, and grid interconnect, embeds roughly 6-8 tonnes of copper per MW, so a 200 MW campus alone consumes on the order of 1,200-1,600 t [S4].
Material copper intensity is highest where resistivity, thermal endurance, and mechanical stability under cyclic loading all have to be met simultaneously. Generators and wind turbine nacelles are textbook examples: copper magnet wire produces the electromagnetic field, must handle continuous thermal cycling, and cannot be downgraded to aluminum without measurable efficiency loss [S5]. For engineers specifying copper material in substations, the relevant trade-off is conductor cross-section versus current density, with 1.5-3.0 A/mm² typical for continuously loaded busbars at 70°C.
Battery energy storage systems (BESS) are a third grid-adjacent sink and growing fast. Copper is used in current collectors, cell-to-module interconnects, and DC bus structures, with purity and conductivity requirements close to those of traction-motor windings [S5]. The copper-per-MWh of BESS is lower than per-MW of generation, but the BESS buildout cycle is much shorter: 4-9 months for containerized systems versus 2-5 years for new substations.
EVs: the higher-intensity, shorter-cycle sink

The EV copper loading factor is the headline number: 3-4x a combustion vehicle, and the differential sits in copper-rich components that EVs add or upsize, including the traction motor (roughly 60-100 kg of copper in a typical 150-200 kW drive unit), the high-voltage cabling harness, the on-board charger, the DC-DC converter, and the power distribution unit [S3]. Pure battery-electric buses and Class 8 trucks run 10-20x a passenger car's copper content per unit.
For procurement teams, the practical implication is that EV copper demand is lumpy and follows OEM build schedules, while grid copper demand is a slow, capital-budget-driven baseline. A 1 million-unit EV year at 80 kg average copper content is 80,000 t of new copper demand; a 200 GW grid buildout spread across transformers, conductors, and grounding is a similar order of magnitude but spread over 5-10 years [S3]. The first bids up spot cathode and rod prices; the second absorbs mill output steadily.
Recycling and substitution modify the picture at the margin. CDA-grade copper recycling now supplies roughly 30-35% of annual demand in major consuming regions, but secondary output cannot grow fast enough to offset the 48% net-new demand in IEA's net-zero scenario [S3]. Substitution is concentrated in applications where conductivity loss is acceptable, mainly overhead distribution conductor (aluminum) and some busbar (aluminum-clad), and has not materially displaced copper in transformer windings, traction motors, or BESS interconnects.
Comparison: grid vs EV vs data center copper demand
Three criteria separate the three competing sinks for the 2026-2030 cycle: cycle speed, intensity per unit, and substitutability. Grids are slow-cycle (multi-year capital projects) but high-total-volume and low-substitutability in transformer and T&D use; EVs are fast-cycle and very high intensity per unit (3-4x combustion) but moderately substitutable in non-traction wiring harnesses; data centers are medium-cycle (12-24 months for new builds) with high intensity per MW (6-8 t/MW) and very low substitutability in bus and grounding [S3][S4][S5].
On the supply side, all three compete for the same cathode, rod, and busbar output from a small number of integrated smelters. New mine capacity in Peru and Chile added tonnage in 2025 but those were described in 2026 coverage as the last easy deposits, and S&P Global has framed the gap as requiring the equivalent of one new Escondida-class mine per year for 30 years, a pace the industry is not on track to match [S4]. J.P. Morgan's 2026 estimate of 475,000 t of new data center copper demand in installations alone sits inside that supply envelope, and grid plus EV demand dwarfs it [S3].
For a process engineer, the actionable comparison is: if you are specifying for a substation or a BESS container, lock rod and busbar forward contracts now because the supply pressure is structural, not cyclical; if you are specifying for an EV drive unit, focus on magnet wire grade and supplier qualification because the constraint is at the OEM tier, not the LME; if you are specifying for a data center, copper pressure transmitter and flow meter tubing and busbar are competing for the same mill output as every other buyer in your region.
Limitations, failure modes, and what to track next
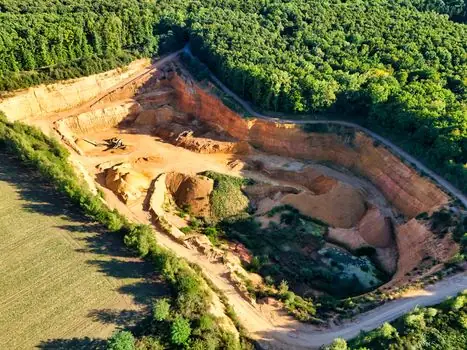
Forecast variability is wide because copper demand is scenario-driven, not point-forecast. IEA's STEPS (Stated Policies), APS (Announced Pledges), and SDS/NZE (Net Zero) scenarios differ materially, and the 48% by 2040 figure is the SDS ceiling, not a central case [S3]. Macro headwinds, Chinese property-cycle construction demand, and any deceleration in AI training compute could all push the central case lower without changing the structural direction.
The IEF and S&P Global both flag ore-grade decline, long mine lead times, and geographic concentration of supply as the binding supply-side constraints, which means even a 10% demand miss leaves the market tight rather than balanced [S1][S6]. China and the rest of Asia are expected to account for 60% of incremental demand growth between 2025 and 2040, so regional premia in Shanghai and Singapore will lead London [S1].
Trackable signals over the next two quarters: monthly LME and SHFE warehouse stocks; copper rod premiums in China and the EU; the 2026 mine production guidance from major producers (Freeport, BHP, Codelco, Glencore); and any revision to IEA scenario copper coefficients in the next World Energy Outlook. Adjacent engineering demand to watch: industrial valve and PLC build cycles in substation retrofit, which are downstream of the same copper availability that constrains the busbar market.
See also our earlier report, Cooling Tower Lead Times 2026: Two-Tier Market and Schedule Tactics.