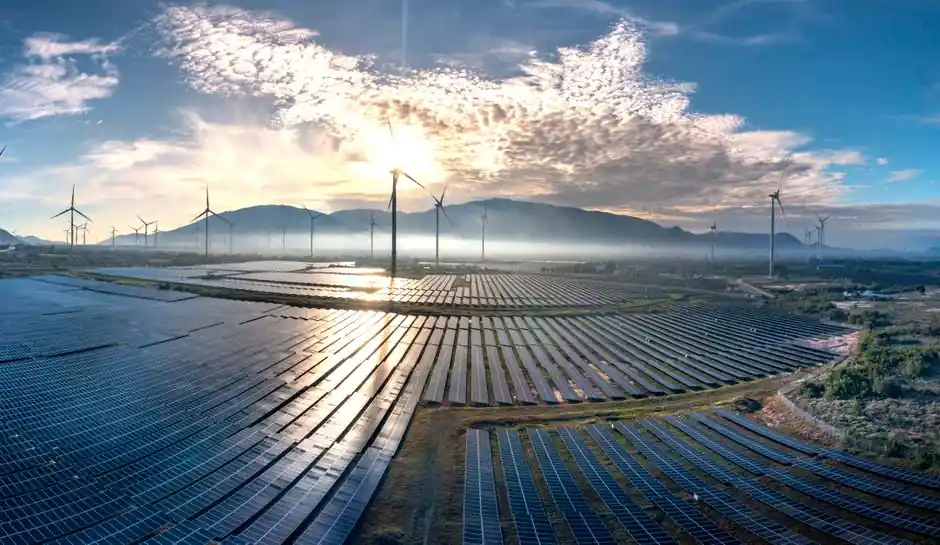
Copper intensity in modern wind, solar PV, and stationary battery projects spans 440 lbs/MW for lithium-ion storage up to roughly 14,900 kg/MW at the high end of utility-scale solar, with offshore wind sitting at the top of the range at about 21,068 lbs/MW [S3][S5].
The ratio is the headline number engineers and procurement teams track: renewable power generation uses four to six times more copper per installed megawatt than fossil-fueled or nuclear plants, driven by cabling, generator windings, transformer copper, and grounding systems [S3][S5].
Wind turbine copper breakdown: where the metal actually goes
A typical 3 MW wind turbine contains up to 4.7 tonnes of copper, with 53% in cable and wiring, 24% in the turbine and power-generation components, 19% in turbine transformers, and 4% in step-up transformers [S3]. More than half the copper in a turbine sits in the vertical cable run up the tower, since nacelle-to-base runs can exceed 100 m on modern units [S2].
Offshore wind is the copper-intensive outlier: an onshore wind farm uses roughly 7,766 lbs of copper per MW, while an offshore installation uses 21,068 lbs/MW, a 2.7x jump driven by inter-array cabling, subsea export cable, and salt-air corrosion allowances on tower wiring [S3]. The durability advantage matters: copper's resistance to marine corrosion is repeatedly cited as the reason offshore layouts rely on it over aluminium for dynamic and subsea sections [S2].
BloombergNEF modelling projects copper intensity in onshore wind will fall by about 10% to roughly 2,500 kg per MW by the end of the 2020s, as larger rotors, higher-voltage nacelle architectures, and selective aluminium substitution in low-current circuits reduce per-MW metal load [S4]. Offshore wind intensity is forecast to stay near current levels because longer inter-array cable runs and deeper-water substations offset generator-side savings [S4].
Solar PV copper intensity: 5.5 tons/MW and the busbar problem
Utility-scale solar PV systems contain approximately 5.5 tons of copper per MW, split between cell-level busbars, string and homerun DC wiring, inverter internals, and the AC medium-voltage collection cable back to the substation [S3][S8]. Copper is also specified for the heat-exchanger circuits in concentrating solar thermal plants, though PV dominates new build [S2].
For a sense of scale, Navigant Research projects 262 GW of new North American solar installations between 2018 and 2027 will require 1.9 billion lbs of copper, a figure that lines up with the 5.5 tons/MW factor at 75% capacity factor assumptions [S3].
The physical reason copper stays in the bill of materials: it is the most cost-efficient conductor below silver on the conductivity scale, it is ductile enough to be drawn into the thin ribbons that contact silicon cells, and it solders reliably under the thermal cycling a rooftop or desert array sees over 25 years [S2]. Aluminum substitution is possible in the AC collection cable but it does not work in the DC string wiring or the cell-level ribbons without redesigning the module [S2].
Battery storage copper intensity: 440 to 540 lbs/MW and rising with duration
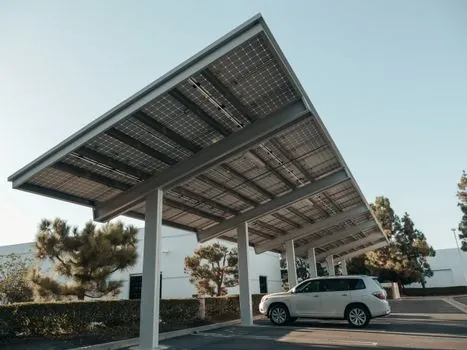
Stationary battery storage uses 440 lbs of copper per MW for a lithium-ion system and 540 lbs/MW for a flow battery, based on the Copper Development Association figures that circulate across the industry [S3]. The copper sits in cell current collectors, busbars linking modules to power-conversion systems, and the AC cabling that ties the battery container to the medium-voltage transformer [S2].
Intensity rises with duration: a 4-hour lithium-ion system carries more DC busbar copper per MW than a 1-hour system, because the cell-to-pack wiring has to carry sustained current for longer thermal windows. Flow batteries trend higher than lithium-ion because the electrolyte pumps, piping, and stack wiring all add metal that a sealed Li-ion pack avoids [S3].
Across the United States, 5,752 MW of storage capacity has been announced and commissioned, which at 440 lbs/MW implies on the order of 1.15 million tons of copper demand from stationary storage alone, before EV charging and grid services load on top [S3]. Battery storage copper intensity is small next to offshore wind, but the installation cadence is what moves the aggregate: storage gets built in months, not the years a wind farm takes to permit and install [S3].
Comparison of copper intensity across wind, solar, and battery projects
For a project planner running material take-offs, the four anchor data points are onshore wind at 7,766 lbs/MW, offshore wind at 21,068 lbs/MW, utility solar at 12,125 lbs/MW (5.5 tons), and lithium-ion storage at 440 lbs/MW [S3]. The aggregate range across the renewable generation mix is 440 to 21,068 lbs/MW, a 48x spread driven by cable length, voltage architecture, and whether the asset sits in seawater or on a desert pad [S3][S5].
On a like-for-like basis, copper intensity in copper material selection for renewable projects is four to six times higher than conventional thermal generation, where the rough benchmark is 1 tonne of copper per installed MW for a fossil or nuclear plant [S5]. The implication for procurement is that switching one GW of gas capacity to solar PV roughly triples copper demand at the plant boundary, and switching one GW of onshore wind to offshore wind nearly triples it again [S3][S5].
At the system level, the IEA expects clean-energy copper demand to reach 600 kt per year by 2040 in its base case, with offshore wind alone accounting for nearly 40% of that copper pull because of the cable content [S1]. The same IEA scenario puts EVs and battery storage at about half of total clean-energy mineral demand growth, with copper third by weight after graphite and nickel [S1].
Where copper goes inside a wind or solar plant: the BOM
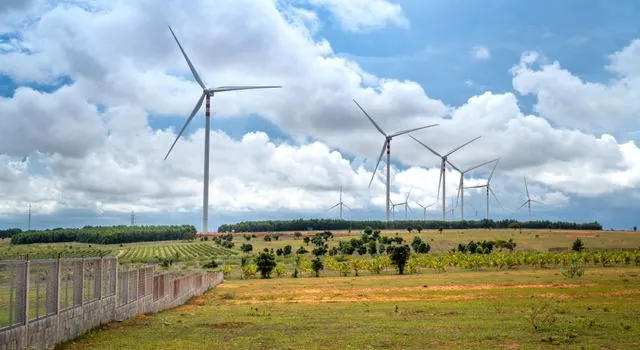
In a wind turbine, the copper bill of materials is generator stator and rotor windings, the tower cabling (often 630 mm² or larger cross-linked polyethylene), the nacelle-to-base control and power cable, the step-up transformer windings, and the grounding grid at the foundation [S2][S3]. Cable and wiring make up 53% of the total, so any project that can shorten the cable run, raise the collection voltage, or move to a higher-efficiency generator sees the largest per-MW copper savings [S3].
In a solar PV plant, the BOM is module-level ribbons and busbars, string DC cabling, combiner boxes, inverter internal busbars, the medium-voltage AC collection cable, the step-up transformer, and the substation grounding grid [S2]. Copper is preferred over aluminum in the DC side because aluminum terminations are less reliable under the 25-year thermal cycling of a utility-scale array, even though aluminum is used in some AC collection runs to cut cost [S2].
The recyclability of copper matters at end of life: about one-third of global copper supply is from recycled sources, and copper can be recovered from retired wind turbines, solar panels, and battery packs without loss of conductivity, which softens the primary supply pressure created by the intensity numbers above [S2]. For construction machinery and equipment on renewable project sites, copper also shows up in the wiring harnesses of cranes, pile drivers, and trenchers that install the cable runs.
Selection and sourcing: what to do with these numbers
Engineers specifying a renewable project should anchor the material take-off on three reference intensities: 5.5 tons/MW for utility solar PV, 2,500 to 7,766 lbs/MW for onshore wind (the 2,500 figure being the BNEF end-of-decade projection), and 21,068 lbs/MW for offshore wind [S3][S4]. Add 440 to 540 lbs/MW for any co-located storage block, and the plant-level copper requirement drops out of a simple sum [S3].
Aluminum substitution is real but bounded: BloombergNEF expects aluminum to capture share in onshore wind and solar farm cabling by the end of the decade, which is the mechanism that drives the 10% onshore-wind copper-intensity reduction to 2,500 kg/MW [S4]. The substitution does not extend to generator windings, cell-level ribbons, or subsea dynamic cable, which is why offshore wind and storage intensity figures stay near current levels [S3][S4].
Sourcing has to keep pace: a single 1 GW offshore wind farm at 21,068 lbs/MW is roughly 9,555 tonnes of copper, more than the annual refined copper output of several mid-sized mines, and delivery on that volume is a 12 to 18 month procurement problem rather than a spot-market call [S3]. The takeaway for project schedulers is that cable and transformer lead times now set the construction critical path on most offshore wind builds, not the turbine delivery slot [S1][S2].
Trackable signals over the next two quarters: the next IEA Critical Minerals update for any revision to the 600 kt per year 2040 copper demand figure, the next BloombergNEF aluminium-versus-copper substitution update for onshore wind, and the next Codelco cathode premium read for what refined copper supply tightness is doing to renewable project EPC budgets [S1][S4]. Codelco 2026 cathode premiums above USD 500/t are already distorting regional spreads, and that gap will show up first in the copper take-offs of US offshore wind projects.
Spec-level background on the components involved: checking and testing apparatus.