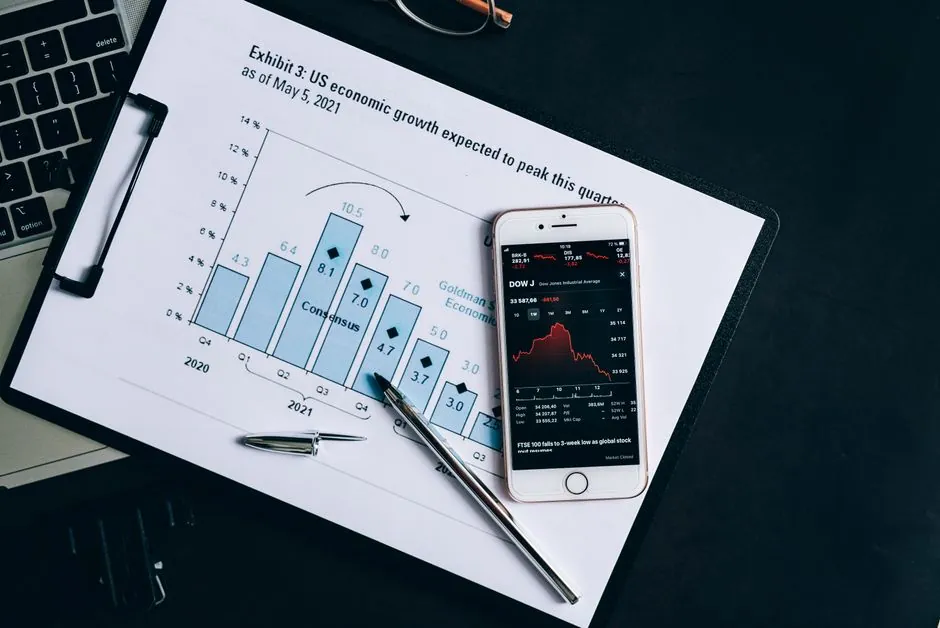
Data center cooling spend in 2026 falls in a USD 12.4B to USD 31.4B band across seven published forecasts, with CAGR estimates spanning 14.9% to 22.3% for 2032-2033 horizons [S1][S2][S4][S7][S8].
Liquid cooling is the consistent outlier: standalone liquid-cooling markets are sized at USD 5.58B-5.7B in 2026, growing at 18.6%-26.4% CAGR, roughly 1.5x to 2x the rate of the broader cooling stack [S3][S5].
Why 2026 Forecasts Diverge on Total Market Size
The USD 12.4B-USD 31.4B spread in 2026 totals reflects scope definition more than disagreement on growth: Mordor Intelligence and MarketsandMarkets focus on dedicated cooling hardware and services (USD 12.41B-13.23B) [S1][S7], while Grand View and Fortune Business Insights include adjacent infrastructure (UPS, precision AC integration, services), pushing the figure to USD 21.0B-31.4B [S2][S4].
Rack Solutions' bottom-up channel-side reading lands at USD 22.81B for 2026, up from USD 19.5B in 2025, which aligns with the mid-band of the wider category [S8]. For specification work, the safe engineering anchor is to treat the 2026 total cooling TAM as a USD 12B-31B envelope and pin any procurement budget to a defined scope: cold-plate and immersion solutions only, or inclusive of CRAH/CRAC, chillers, and controls.
Liquid Cooling: Cold Plate vs Immersion vs Spray, by Spec
Cold plate liquid cooling holds more than 55% of the 2026 liquid-cooling value (over USD 3.1B), driven by direct CPU/GPU thermal management, modular integration, and lower retrofit risk [S3]. Immersion is the fastest-growing format, claiming 80% higher energy efficiency and PUE 1.02-1.03 versus air baselines, with single-phase and two-phase variants specified per dielectric fluid choice (typically synthetic fluorinated or hydrocarbon fluids) [S3].
Spray liquid cooling remains a smaller niche, chosen where direct dielectric contact is acceptable and rack height permits manifold redistribution. The decision rule for a 2026 build: cold plate for retrofit brownfield and mixed GPU/CPU loads; single-phase immersion for new hyperscale builds above 50 kW per rack; two-phase immersion reserved for HPC-class densities where the boiling-point dielectric justifies the fluid cost [S3][S5]. Related coverage in the ASHRAE and IEC standards map covers the regulatory boundary that drives these format choices.
Capacity, Density, and the 100 GW Build Cycle
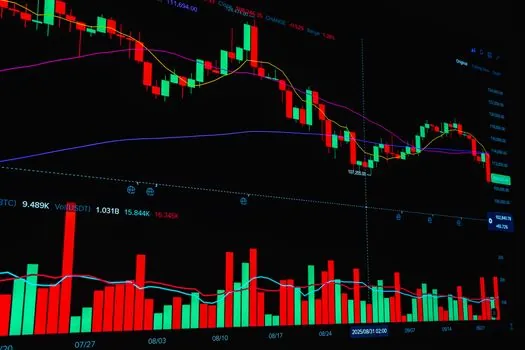
JLL's January 2026 outlook projects nearly 100 GW of new data center capacity to be added between 2026 and 2030, effectively doubling the global installed base [S6]. That build cadence is the upstream driver: each new MW shifts cooling spend from CAPEX-heavy chilled-water plants toward modular, factory-built skids.
Hyperscale data centers are the largest 2033 segment in MarketsandMarkets' segmentation, registering a 19.4% CAGR [S1]. For engineers specifying a new hall, the practical consequence is that liquid-cooling CDUs and immersion tanks are now ordered on the same critical-path schedule as the IT gear, not as a follow-on retrofit. Liquid-cooling components themselves are growing at a 29.5% CAGR in the same forecast, more than double the broader cooling market [S1].
Regional Split: North America Anchors, Asia-Pacific Closes Fastest
North America holds 36%-44.1% of 2026 cooling revenue across the major reads, with the US share anchored by hyperscale campuses in Northern Virginia, Phoenix, and Dallas [S1][S3][S5]. MarketsandMarkets pegs North American cooling spend at an 18.6% CAGR through 2033, the highest regional rate among developed markets [S1].
Asia-Pacific is consistently flagged as the fastest-growing region in liquid cooling, with Precedence Research calling it the leading growth region for 2026-2035 [S5]. For sourcing teams, that translates to two viable 2026 procurement lanes: North America for proven, service-backed hyperscale reference designs; APAC (notably Taiwan, Singapore-adjacent Johor, and India) for new capacity where liquid-cooling vendors are co-located with semiconductor and server OEMs.
End-User Adoption Signal: 21% Liquid-Cooling Intent in 12 Months

S&P Global's 2026 enterprise survey reports that 21% of data center decision-makers plan to shift to liquid cooling over the next year, up from 13% in the 2024 reading [S9]. That is a 61.5% relative jump in stated intent in 24 months, and it lines up with the analyst CAGR band of 18.6%-26.4% for liquid cooling specifically [S3][S5].
The caveat: stated intent overstates shipped capacity. Cloud providers (AWS, Microsoft Azure, Google Cloud) drive the highest end-user CAGR at 29.5% in Persistence Market Research's build, and they also absorb the bulk of the order pipeline [S3]. Enterprises above 30% share in 2026 will convert more slowly because their brownfield CRAC/CRAH base still has 8-12 year amortisation runway, which pushes most enterprise liquid deployments into hybrid air-plus-rear-door-heat-exchanger configurations rather than full immersion retrofits [S3].
Competitive Landscape and Sourcing Risks for 2026
Vertiv, Johnson Controls, and Schneider Electric are the three named "star players" in MarketsandMarkets' competitive read, with combined strength in integrated cooling skids, controls, and global service networks [S1]. CoolCentric, Midas Immersion Cooling, and Iceotope Precision Liquid Cooling are flagged as the SME/startup tier with strong niche positions in immersion and precision liquid delivery [S1].
The 2026 sourcing risk is lead time on cold plates and immersion tank fabrication, not on chillers or CRAHs. Order placement for liquid-cooling skids in late 2025 has carried quoted lead times of 30-45 weeks for hyperscale-class CDUs, with the bottleneck at vacuum-brazed cold-plate manufacturing rather than at the pump or CDU integrator. For teams planning a 2027 capacity go-live, the practical move is to issue long-lead cold-plate POs in 2026 even if the final hall design is still in PCD (preliminary design) stage, then refine CDU specs against actual IT load later. The broader cooling stack, including data logger instrumentation tied to PUE reporting, should be scoped in parallel because ASHRAE TC 9.9 recommended ranges and EPA SNAP refrigerant listings govern fluid and reporting choices in any 2026 US build [S3].
Trackable next signals: (1) the 2026-2030 GW build pacing per JLL's quarterly updates [S6], and (2) the gap between S&P Global's 21% liquid intent and shipped immersion-tank volumes, which the next 18 months of vendor 10-K disclosures will resolve. Wider context on adjacent construction machinery and equipment demand tracks the same data center build-out, since 100 GW of new capacity implies a sustained pull on site-prep and generator ecosystems through 2030.
The underlying component specifications are covered under lamps and light fittings.