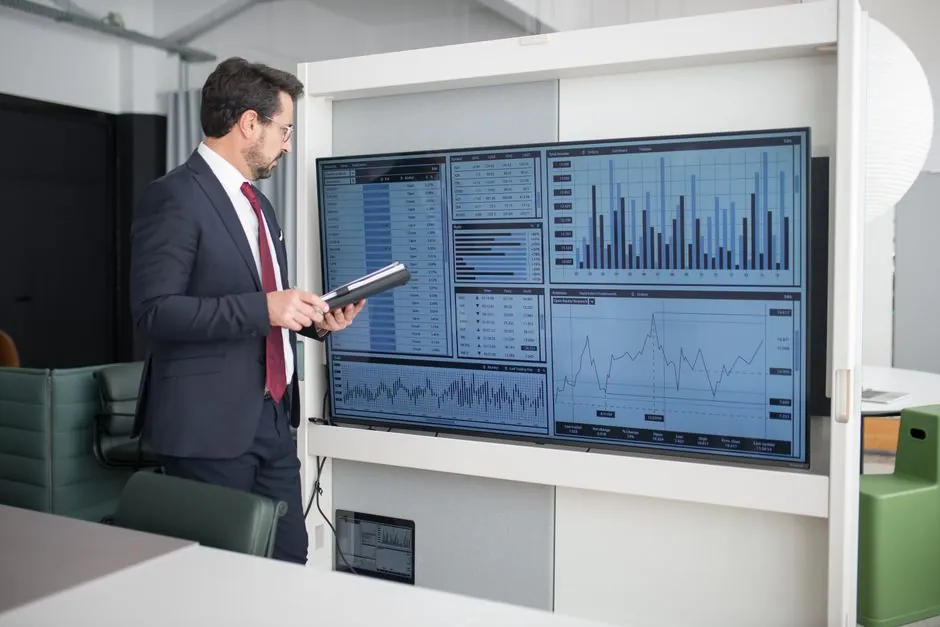
Four flat-panel technologies now split the 2026 specification battle: LED-backlit LCD, OLED, quantum dot (QD), and legacy PDP, with LCD still holding the largest unit share and OLED pushing hard into video-wall and signage. Allied Market Research sizes the global interactive display market at $14.63B in 2018 and projects it to $29.19B by 2026, an 8.80% CAGR over 2019-2026 [S1].
Panel type splits into three buckets in that 2026 outlook: flat panel, flexible panel, and transparent panel [S1]. Application splits five ways: interactive table, interactive monitor, interactive kiosk, interactive whiteboard, and video wall [S1]. End-user demand concentrates in education, retail, BFSI, healthcare, military and defense, and transportation [S1].
Technology stack: where each panel type wins and loses in 2026 specs
LCD stays the workhorse in 2026 because it is the lowest cost per square inch and the only mainstream panel that scales from 10-inch industrial HMIs to 100-inch video walls on a single supply chain. Allied Market Research groups the four core technologies as LED, LCD, OLED, and quantum dots, with the LED bucket covering both conventional LED-backlit LCD and direct-view fine-pitch LED [S1].
OLED is winning the premium video-wall and signage slots where contrast ratio, viewing angle, and cabinet depth matter more than unit price. PDP still appears in legacy spec sheets as a reference benchmark: 160-degree viewing angle, 1/6 the thickness and 1/10 the weight of a comparable CRT, with screen sizes of 40-70 inches driven by thick-film cell construction [S3]. That thick-film architecture is exactly why PDP cannot scale below roughly 40 inches, while LCD thin-film caps practical sizes near 20 inches in older comparisons [S3].
Application split: whiteboard, kiosk, video wall, and HMI/panel-meter duty
Education and corporate remain the demand engines for interactive whiteboards, which Allied Market Research calls out as a primary application segment [S1]. Interactive kiosks and interactive monitors pull volume from retail, BFSI, transportation, and healthcare, and are the form factor that overlaps most with industrial HMI panel deployments on the factory floor.
Video walls remain the OLED-leaning application, frequently built from 55-inch or 65-inch tiles, and they overlap with digital panel meter clusters in control rooms where a single large canvas replaces a wall of discrete meters. Flat-panel form factors dominate here because flexible and transparent panels cannot yet match tile-edge alignment under 1 mm, a hard requirement for control-room video walls.
Competitive comparison: LCD vs OLED vs QD vs PDP on 5 spec axes
For a 2026 spec committee the decision pivots on five axes: peak brightness, contrast ratio, viewing angle, maximum size, and cost per square inch. LCD wins on cost and size scalability; OLED wins on contrast and viewing angle; QD wins on color gamut at LCD-like cost; PDP only wins on legacy 160-degree viewing angle and uniform brightness across the panel [S3].
On viewing angle, PDP panels are specified at 140-160 degrees versus older CRTs [S3], which is comparable to OLED but mechanically cheaper for the same diagonal. On size, PDP stops being practical below 20 inches because LCD thin-film saturates that range, and PDP becomes attractive only from 40 inches upward [S3]. On thickness, PDP at roughly 1/6 of CRT depth is the historical benchmark [S3]; OLED now beats that on premium video walls, but at higher BOM. On cost, LCD still leads by a wide margin on $/inch, which is why industrial display tenders default to LCD unless the spec explicitly demands OLED contrast or QD color volume.
Regional and end-user demand gates in 2026
Allied Market Research segments the 2026 outlook across four regions: North America, Europe, Asia-Pacific, and LAMEA [S1]. North America is projected to grow at the highest CAGR of those four, driven by display-technology adoption in education and corporate [S1]. Asia-Pacific remains the manufacturing and supply base for the panel glass itself, so regional ASPs for the same LCD SKU diverge by logistics, not by panel performance.
End-user demand clusters in education, retail, BFSI, healthcare, military and defense, and transportation, with education and corporate as the named demand drivers for interactive whiteboards [S1]. Healthcare and transportation pull smaller volumes but harder specs: 24/7 duty, wider temperature range, and sunlight-readable brightness, which is where HMI panel and ruggedized industrial display designs overlap with the kiosk and whiteboard supply chain. For deeper supplier and spec data, see the companion piece on display panel market share and 2026 vendor spec gates.
Limitations, failure modes, and selection pitfalls

High cost is the named brake on transparent and quantum dot panels in the 2026 outlook [S1]. For PDP specifically, the failure mode is well known: high unit price relative to LCD at the same diagonal, which is why PDP is now a legacy benchmark rather than a live procurement option for new builds [S3][S4].
For LCD the failure modes are edge-light bleed on large diagonals, polarizer yellowing under sustained UV, and brightness drop on capacitive touch stacks, all of which are why video-wall duty increasingly migrates to OLED. For flexible and transparent panels, the limitation is supply maturity: Allied Market Research flags flexible display growth as a driver and transparent displays as a cost-side restraint in the same 2026 outlook [S1], so a spec writer should treat them as premium options, not default substitutes for flat LCD. The forward demand picture is tracked in Display Panel Demand 2026-2030: spec gates, capacity signals, sourcing reality.
Sourcing, standards, and what to track next
Public 2026 references for panel sourcing remain dominated by market-research outlooks rather than binding standards; the underlying panel interfaces (HDMI, DisplayPort, eDP, MIPI DSI) are governed by their own consortium specifications, not by IEC/ISO panel-performance standards. For industrial buyers, the practical spec gates are brightness (nits), contrast ratio, viewing angle, operating temperature, MTBF, and touch-stack type, and these are typically pulled from the panel OEM datasheet rather than from a single international standard. [S1]
Two trackable signals for the rest of 2026: the LCD vs OLED ASP gap on 55-inch and 65-inch video-wall tiles, and the rollout of QD-enhanced LCD in education tenders. If the ASP gap on 55-inch tiles narrows below roughly 1.5x, expect 2027 education and corporate video-wall specs to drift from LCD to OLED; if QD-enhanced LCD wins the education refresh cycle, OLED video-wall growth slips into 2028.