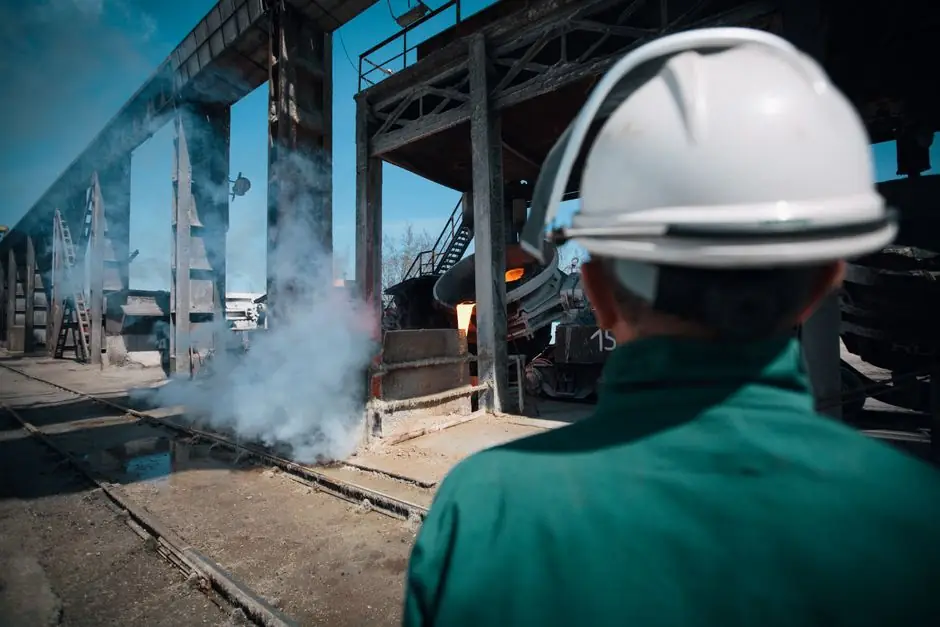
Electric arc furnaces accounted for 30.3% of world crude steel production in 2025, up from roughly 27% in 2019, according to the World Steel Association's 2026 World Steel in Figures dataset [S2]. The dataset, finalised on 8 June 2026 and reflecting ownership as of 31 December 2025, puts the average EAF share at 30.3% across the reporting membership.
The same data point sits in a wider band depending on the source: one market analysis puts the 2025 EAF share at approximately 32.5% of global crude steel output [S4], while country-level breakdowns show the global average hides a 90-point spread between the most EAF-heavy economies and the most blast-furnace-heavy ones. Germany produced 37 million tonnes of crude steel in 2024, only 2% of world output, and roughly 30% of that volume came from EAFs [S1].
Where the EAF share is highest, and where it is structurally low
The EAF route depends on three input streams: ferrous scrap, direct reduced iron (DRI), and pig iron/hot-briquetted iron. National EAF penetration therefore correlates tightly with scrap availability, electricity cost, and the vintage of installed blast-furnace capacity.
The OECD's capacity outlook notes that 82.1% of Chinese outbound steel-sector investment in the period studied went to ASEAN, where new capacity is increasingly DRI-EAF rather than integrated blast-furnace [S3]. That investment pattern is the mechanism behind the slow global drift upward in the EAF share: the new capacity being built in emerging Asia and the Middle East is electric-arc, even as legacy Chinese integrated capacity remains in place.
Selection logic: when EAF wins, when it does not
EAF economics are decided by the spread between scrap/DRI cost and finished-steel price, not by technology preference. In scrap-rich, electricity-cheap jurisdictions, EAF beats integrated steelmaking on both capex (roughly one-fifth the cost per tonne of annual capacity) and CO2 intensity (around 0.6-0.7 t CO2/t steel for scrap-EAF versus 1.8-2.2 t CO2/t for the integrated route when using coal-based reductant) [S2]. The route is unsuitable where high-purity flat-product grades require tight nitrogen control beyond what scrap-fed EAFs can deliver without DRI dilution, or where local scrap supply is thin and imported DRI erodes the cost advantage.
For a process engineer choosing between routes, the decision tree reduces to four numbers: local scrap arisings (t/yr), grid CO2 intensity (kg CO2/kWh), delivered DRI price (USD/t), and the grade mix (long products vs flat products). Where all four favour EAF, the EAF share will continue to climb. Where any one of them does not, the blast furnace retains a defensible niche, especially for thick-plate, heavy-gauge electrical, and exposed automotive applications where the silicon steel and stainless steel grades that integrated mills specialise in remain hard to replicate consistently in a 100% scrap-fed EAF.
Capacity additions through 2026: where the new tonnage is going
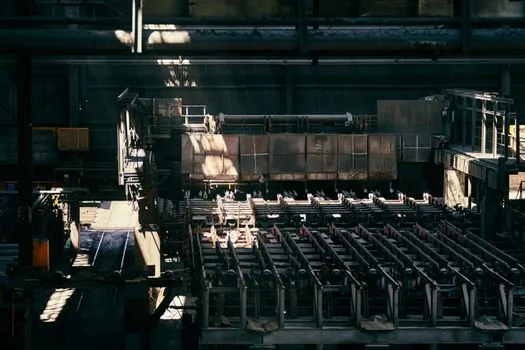
The OECD's steelmaking capacity outlook lists new EAF-based projects in the MENA region (Egypt, Oman, Saudi Arabia), South Asia (India's planned capacity expansions), and Southeast Asia (Vietnam, Indonesia), with first production dates running from 2025 through 2027 [S3]. These are predominantly DRI-EAF paired plants, designed to use a mix of natural-gas-based DRI and imported scrap. Their commissioning timeline is the single biggest variable in the 2026-2027 EAF share number.
Risk to that timeline is grid power, not scrap supply. Several of the planned Indian and Egyptian EAF projects are tied to dedicated renewable-power purchase agreements, and slippage on the PPA side pushes commissioning into 2027. The Chinese domestic picture is the offsetting drag: existing blast-furnace capacity continues to operate at moderate utilisation, and any accelerated decommissioning of older Chinese blast furnaces would lift the global EAF share faster than the new MENA and ASEAN capacity alone.
What the 30.3% number does and does not tell you
The 30.3% figure published by worldsteel is a tonnage-weighted average across reporting members, finalised 8 June 2026 with 2025 ownership data [S2]. It is a backward-looking accounting number, not a forecast, and it does not distinguish between scrap-EAF, DRI-EAF, and pig-iron-charged EAF, which have very different carbon footprints. Engineers using the figure to make route-selection decisions should treat it as a benchmark, not a specification, and pull the underlying plant-level data when grade-specific CO2 reporting is required.
The market-research figure of 32.5% for 2025 [S4] likely reflects a different membership scope and a later cut-off; the 2.2-point gap between the two is small enough to be definitional rather than factual. For a working process engineer, the practical conclusion is that roughly two-thirds of world steel is still made by reducing iron ore with carbon, and roughly one-third is melted from scrap or DRI in an arc, and the third is gaining share at a rate of roughly half a percentage point per year, with the next data point arriving in mid-2027 when worldsteel publishes the 2026 production figures.
Adjacent materials and where EAF route choice shows up downstream
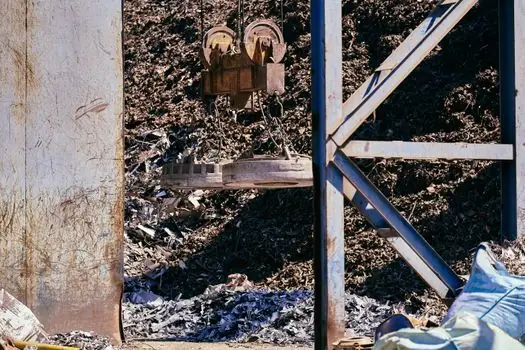
Route choice propagates into product specifications. EAF-only producers typically specialise in long products (rebar, sections, steel fiber feedstock, wire rod) and merchant bar, where the carbon steel tolerance bands are wide enough to absorb residual copper and tin from scrap. Flat products, particularly automotive exposed panels and deep-drawing grades, still come predominantly from integrated mills, as do most electrical steels (silicon steel for transformer laminations) and the austenitic stainless steel grades. Welded mesh and reinforcement products (steel mesh) are overwhelmingly EAF-sourced globally. [S2]
For a working engineer specifying material, the practical rule is: if the spec allows EAF feedstock (which most rebar, mesh, and structural-grade specs do), the alloy steel and stainless grades that require vacuum degassing or argon-oxygen decarburisation still largely come from integrated mills, and the procurement lead time on those grades will be longer and the price will carry an integrated-route premium tied to the iron ore and coking coal benchmarks.
Trackable signals over the next two quarters: worldsteel's monthly crude steel by-process table (due in the 2027 mid-year release), the OECD's 2026 capacity utilisation update, and commissioning announcements for the Egyptian, Omani, and Indian DRI-EAF projects flagged in the 2024 capacity outlook [S3]. Any of those three will move the EAF share number by half a point or more.
This topic is covered further in Hooked-End vs Straight Steel Fiber: Pull-Out Mechanics and Spec Tradeoffs.