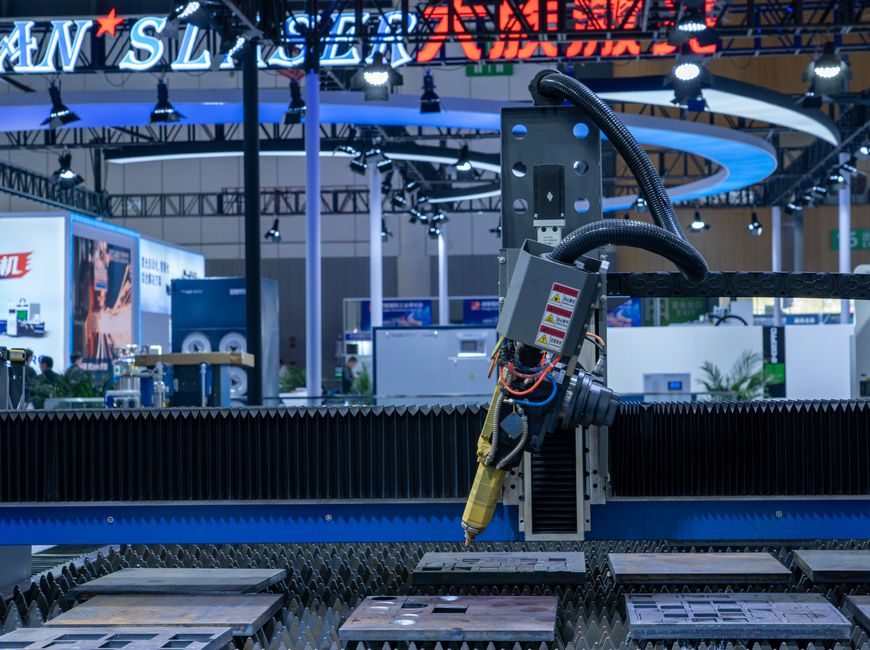
Electrolyzer demand is forecast to grow at an 80.8% CAGR from 2025 to 2035, lifting the global market from USD 5.88 billion in 2025 to USD 2,196.4 billion by 2035, according to Market Research Future's 27 May 2026 update [S3].
Four stack chemistries anchor the segment — Proton Exchange Membrane (PEM), alkaline, Solid Oxide Electrolyzer Cell (SOEC) and Anion Exchange Membrane (AEM) — split across three power bands: below 500 kW, 500–2,000 kW and above 2,000 kW [S3]. The technology-mix and rating-class split is now the main filter engineers use when sizing a plant and selecting instrumentation such as pressure transmitters and flow meters for the hydrogen and oxygen outlet manifolds.
Technology Stack: PEM Leads, Alkaline Catches Up
PEM electrolyzers currently lead the installed base because of their high current density, fast dynamic response and tolerance of intermittent renewable input [S3].
Alkaline stacks — both traditional and modern pressurized designs — are seeing rapid growth on the back of lower catalyst cost (no platinum-group metals) and mature supply chains from the chlor-alkali industry [S3]. According to the report, the 2024 market size is USD 3.25 billion, the 2025 market size is USD 5.88 billion, and the market is forecast to expand at an 80.8% CAGR over 2025–2035 [S3]. SOEC remains the high-temperature option for integration with waste heat or nuclear, while AEM sits at the early-commercial edge targeting the sub-MW niche.
Rating Bands and Application Split
The capacity segmentation — under 500 kW, 500–2,000 kW, and above 2,000 kW — maps almost one-to-one to use case: containerized pilot and refuelling units sit below 500 kW, mid-scale industrial hydrogen hubs cluster in the 500 kW–2 MW band, and gigawatt-scale green-ammonia or e-methanol complexes dominate the >2 MW segment [S3].
Application-wise, hydrogen production remains the headline use, with energy storage, ammonia production, methanol production and metallurgical processes as the four largest adjacent offtake lanes [S3]. Methanol and ammonia projects in particular are driving the >2 MW bucket, and each green-ammonia train typically bundles hundreds of industrial valves for electrolyte recirculation, oxygen venting and product-gas isolation. The transport-fuel-cell crossover — flagged in Research and Markets' earlier outlook as the highest-CAGR end-use — is now visible mainly in 2024–2025 pilot fleets rather than mass volume [S2].
Regional Split: North America Leads, Asia-Pacific Fastest
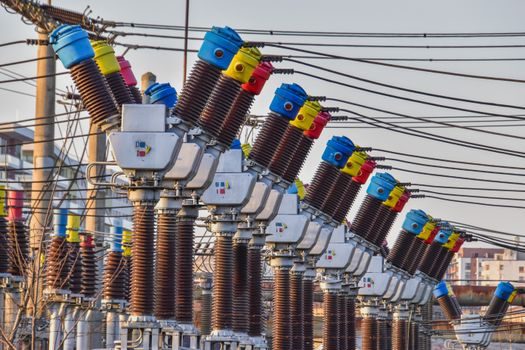
North America remains the largest regional market for electrolyzers, anchored by US Inflation Reduction Act tax credits and Department of Energy hydrogen-shot funding rounds that favour domestic stack manufacturing [S3].
Asia-Pacific is the fastest-growing region, propelled by China's provincial green-hydrogen subsidies, India's national green-hydrogen mission, and South Korea and Japan's long-term offtake contracts with steel and refining majors [S3]. Europe sits in the middle: ambitious REPowerEU targets collide with permitting bottlenecks, so announced gigawatt projects translate to commissioned capacity on a multi-year lag. Middle East and Africa remain the wild card — low-cost solar and stranded-gas reinjection economics keep pulling project announcements, but firm EPC awards are still episodic.
Decision Criteria: How PEM, Alkaline, SOEC and AEM Compare
The four chemistries split cleanly on operating temperature, current density, footprint and cost, and that is the comparison a procurement engineer actually needs at the desk. [S1]
For an engineer building the BOP around a stack, those four axes — temperature, density, cost, dynamic response — set the spec for the supporting PLCs and for the pressure sensors on each gas outlet.
Cost Stack and Bankability Constraints
Capital cost per kW installed is still the single largest gating metric, and the published outlook identifies cost reduction as the central lever between the 2025 baseline and the 2035 figure [S3].
The cost stack decomposes into the stack itself (membranes, catalysts, bipolar plates, porous transport layers), the BoP (transformer-rectifier, water purification, gas conditioning, cooling) and the integration premium (grid connection, hydrogen compression or liquefaction, storage). Stack-level cost is widely expected to follow a learning-curve trajectory measured in percentage decline per doubling of cumulative capacity — though the report itself publishes only the headline USD-Bn trajectory, not the per-kW slope [S3]. Bankability is gated less by stack cost and more by offtake certainty, water supply, and the qualification timeline for safety instrumentation, which is why several 2025–2026 project finance deals have closed on shorter tenors with milestone-based debt drawdowns.
Supply Chain and Vendor Landscape
The active global vendor list is now dominated by Nel Hydrogen (NO), Siemens Energy (DE), ITM Power (GB), Plug Power (US), Air Products and Chemicals (US), Thyssenkrupp (DE), McPhy Energy (FR), Ballard Power Systems (CA) and Hydrogenics (CA) [S3].
That roster is the shortlist every EPC will tender against in 2026, but it is not the whole market — Chinese stack makers (LONGi Hydrogen, Sungrow Hydrogen, Peric) are the volume backbone for Asia-Pacific projects and increasingly bid into Middle East tenders. A related sourcing story for downstream fuel-cell integration is mapped in Fuel Cell Stack Supply Shortage 2026, which tracks how electrolyzer capacity and fuel-cell-stack demand are now pulling on overlapping catalyst and membrane supply lines. For bankability benchmarks on the same projects, see the side-by-side cost-stack breakdown in Green hydrogen 2026: cost stack, electrolyzer mix and bankability gaps.
Limits, Failure Modes and Open Questions

Three hard constraints still bind the segment in 2026: water availability at the gigawatt scale, rectifier and transformer-rectifier supply lead times of 12–18 months, and the qualification cycle for safety instrumentation in hydrogen service — which is exactly the gate the industrial valves and flame-arrestor supply chain has to clear before any stack can be commissioned. [S2]
On the numbers, the two published outlooks diverge sharply: Research and Markets framed 2024–2029 growth at an 18.69% CAGR with a 2029 value of USD 15.49 billion [S2], while Market Research Future's May 2026 update projects 80.8% CAGR and a 2035 value of USD 2,196.4 billion [S3]. An engineer reading both should treat the lower-growth, lower-aggregate figure as the more conservative anchor and the higher one as the upside scenario contingent on full REPowerEU / IRA / China-subsidy execution. Watch the next two data points: the H2-2026 IDM and DOE hydrogen-shot award shortlists, and the 2026 full-year commissioning number out of China — those are the cleanest signals of which trajectory is actually being built.