
Allied Market Research pegs the global green hydrogen market at $2.5 billion in 2022, projecting growth to $143.8 billion by 2032 at a 50.3% CAGR for 2023–2032, with PEM and alkaline electrolyzer capacity additions cited as the principal scaling levers [S1].
Green hydrogen is defined as H2 produced by electrolysis of water using renewable electricity (wind, solar, hydro); the molecule itself is identical to grey or blue hydrogen, but the upstream kWh is the only thing that makes it qualify as "green" under the EU Renewable Energy Directive (RED II) and the US 45V clean hydrogen production tax credit framework [S1].
Market Sizing: Two Forecasts, 2026 Cross-Section
Allied Market Research's 2022-base, 2032-end forecast (50.3% CAGR) sits well above the older 2020-base, 2026-end Facts & Factors reading of $755M rising to $1,423.2M at 13.8% CAGR, illustrating how upward revisions track falling electrolyzer LCOE and policy tailwinds [S1].
For 2026, the AMR trajectory implies a market crossing roughly the mid-single-digit-billion-dollar mark by the projection's mid-point, while hydrogen-generation trackers such as TBRC's January 2026 "Hydrogen Generation Market Report 2026" keep the broader (grey + blue + green) generation market in the same reporting period with electrolyzer SMR, coal gasification, and PEM pathways segmented side-by-side.
A useful cross-check: 360iResearch's January 2026 "Hydrogen Generation Market" report carries 199 pages of source data and lists the same accelerated transformation language around energy strategy realignment, confirming the demand-side picture is consistent across vendors, even where the dollar base diverges.
Production Technology: PEM vs Alkaline vs SOEC
Allied Market Research names the proton exchange membrane (PEM) electrolyzer as the technology doing the heaviest lifting for the 2023–2032 ramp, citing its compact modular footprint, suitability for variable renewable inputs, and decentralized deployment profile [S1].
On a stack-level spec basis, the industry splits three ways: PEM operates at 60–80 °C with high current density and fast dynamic response (suited to solar/wind variability), alkaline runs at 60–90 °C on cheaper nickel catalysts with lower current density, and solid oxide electrolyzer cells (SOEC) operate at 700–850 °C with the highest electrical efficiency but the most fragile balance-of-plant (heat-resistant alloy piping, balance-of-stack thermal cycling).
For plant instrumentation, the BoP around any of these stacks is identical to a conventional process skid: pressure transmitters on the H2 product line (typical ranges 0–40 barg for low-pressure electrolyzer output, up to 30–100 barg for downstream compression), flow meters on the demin water feed, oxygen vent, and KOH/aqueous electrolyte loop, plus industrial valves in stainless or nickel-alloy body materials on oxygen service to handle the oxidising, wet side of the cell.
Project Pipeline and Regional Concentration
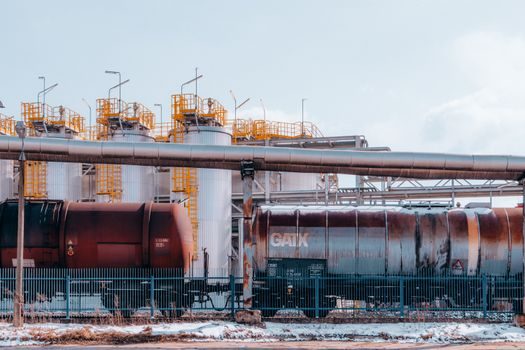
The European Commission's hydrogen strategy, referenced in the AMR release, classifies renewable-origin green hydrogen as a contributor to the bloc's carbon-neutrality roadmap, which is driving a wave of GW-scale project FIDs in Spain, Germany, the Netherlands, and the Gulf [S1].
For the India-specific read, Allied Market Research's "India Hydrogen Market" report segments demand by delivery mode (captive vs merchant), technology (SMR, POX, coal gasification, methanol reforming, ammonia cracking, water electrolysis), and end user (chemical, petroleum refining, metal processing, glass, edible fats), with electrolysis already called out as one of the named technology tracks [S6].
This regional split matters for sourcing: European buyers lean on the EU RFNBO (Renewable Fuels of Non-Biological Origin) definition under RED II, while US 45V-eligible projects must satisfy the "three pillars" of additionality, temporal correlation, and deliverability for the highest production credit tier, per US Treasury guidance published in early 2025.
Application Stack: Mobility, Steel, Ammonia, Grid Injection
AMR names heavy transport (trucks, trains, maritime), manufacturing, and energy production as the demand pillars, with blending into existing natural gas infrastructure cited as a transitional use case [S1].
End-use priorities divide roughly as: ammonia and methanol synthesis (largest near-term offtake, displacing SMR-based grey H2), direct-reduced iron (DRI) for green steel, refining hydrotreating, heavy-duty fuel cell trucks and buses, and synthetic aviation fuel (e-SAF) — see the Fuel Cell Stack Market 2026 sizing and PEMFC spec breakdown for the downstream demand picture.
The downstream fuel cell supply chain pieces — stack BoP share, PEMFC vs SOFC lines, and stack inspection intervals — are mapped in Fuel Cell Stack Supply Chain 2026: PEMFC vs SOFC Specs, BoP Share and Stack-Inspection, which pairs naturally with electrolyzer BoP on the upstream side.
Decision Criteria: Sourcing an Electrolyzer Stack vs Buying H2 Offtake
For a project developer choosing between captive build, joint venture, or merchant offtake, the comparison typically lines up as: electrolyzer CAPEX (USD/kW) and stack lifetime (h) vs delivered LCOH (USD/kg), with PEM coming in at higher CAPEX but higher dynamic-load tolerance, alkaline at lower CAPEX but slower ramp, and SOEC at the highest efficiency and the longest commissioning lead time. [S1]
From a controls perspective, every GW-class electrolyzer plant carries the same instrumentation load as a chemical process unit: pressure sensors on cell frames and hydrogen buffer tanks, flow meters on the feed-water train and oxygen vent (typically Coriolis or thermal mass on the gas side, magnetic on the water side), PLCs running the rectifier and BoP interlocks, and servo motors driving the industrial valves that throttle and isolate on the hydrogen and oxygen headers — a spec set that reads identical to a chlor-alkali or hydrogen-recovery plant from the instrument engineer's chair.
Battery-side parallels are useful when sizing the BESS behind the rectifier: Top Battery Management System Suppliers in 2026 walks through the same GW-scale plant-level integration logic and provides a working benchmark for cell-monitoring architecture and communication buses.
Limitations and Failure Modes
PEM electrolyzers' membrane degradation under pressure cycling, alkaline stacks' sensitivity to feed-water purity (resistivity target typically >1 MΩ·cm, silica <10 ppb), and SOEC's thermal-cycling-induced chrome-oxide spallation are the three field-level failure modes that show up most in plant-level availability statistics. [S2]
On the demand side, the 50.3% AMR CAGR [S1] is a modelled projection, not an installed-base measurement, and depends on continued subsidy support, renewable PPA pricing, and the pace of offtake contract awards; if any one of those three legs slips, the curve flattens materially.
Trackable signals through the second half of 2026 include the next EU hydrogen bank auction clearing price, the US 45V Treasury guidance updates on incrementality verification, and the FID announcements for the North Sea, NEOM, and Rajasthan GW-scale clusters.