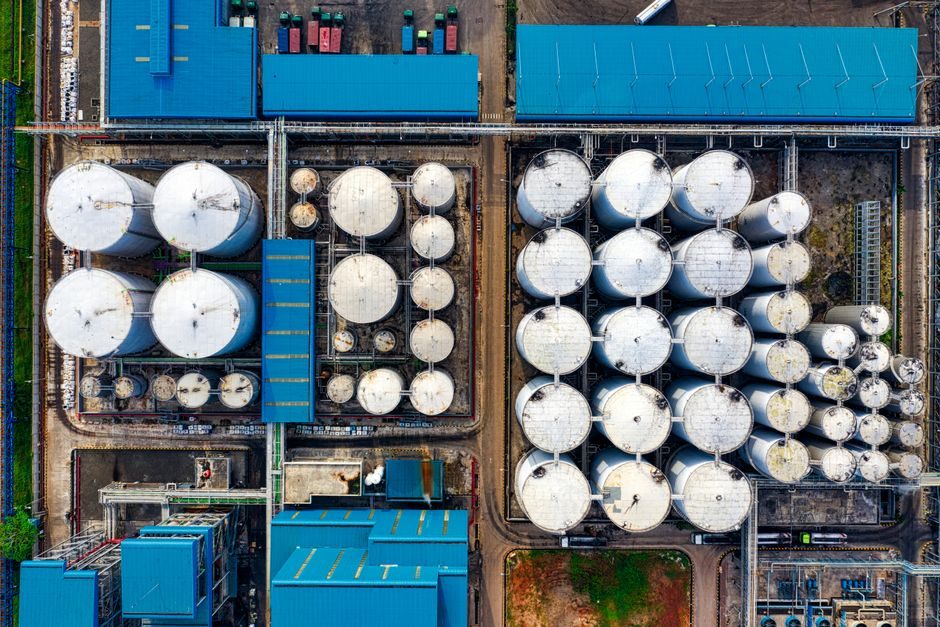
Air Products and the NEOM Green Hydrogen Company moved into full turbine erection in 2026 after awarding Envision Energy a 1.67 GW wind contract — 257 of the 6.5 MW EN-171/6.5 MW platform — to power the Oxagon-based, fully renewable electrolysis complex targeting up to 600 t/day of carbon-free hydrogen by end-2026 [S7].
The wider benchmark is the global hydrogen-generation market, valued at $164.31 billion in 2025 and forecast to reach $178.06 billion in 2026 (CAGR 8.4%), with green hydrogen the fastest-growing source line and Asia-Pacific the largest and fastest-expanding regional segment [S2].
Project Leaders Ranked by 2026 Output Commitment
NEOM Green Hydrogen Company — a three-way JV of Air Products, ACWA Power and NEOM — is the only project that has publicly committed to a nameplate of 600 t/day of green H₂ from a single site fed by dedicated wind and solar, with all 257 Envision turbines scheduled to be fully operational before the end of 2026 [S7]. ACME (India) holds the second slot, with the Duqm project in Oman booked at $4.2 billion of phase-1 capex and a phase-2 commissioning date set for 2030 [S3]. The third track is SARCO and China's Ally Hydrogen, who in 2026 signed a deal to develop a green ammonia plant and an electrolyzer-equipment manufacturing hub in Jazan, Saudi Arabia [S3]. Air Liquide and Siemens Energy retain a leadership position through stack and BoP supply chains feeding multiple Gulf and European projects, even though their own headline 2026 MW numbers sit below the integrated NEOM figure.
On a regional basis, Asia-Pacific is now both the largest and the fastest-growing market for green-hydrogen deployment, and the MENA bloc is the only region with multiple gigawatt-scale projects that have moved past FID into construction [S2][S3].
Electrolyzer Technology Stack and Equipment Specs
PEM and alkaline electrolyzer stacks between 1 MW and 20 MW are the dominant building blocks of 2026 utility-scale projects, with the EN-171/6.5 MW wind platform sized to match a corresponding megawatt block of proton-exchange-membrane electrolysis in the NEOM design [S7]. For process engineers sizing the BoP, three spec dimensions matter: H₂ purity downstream of the PSA (typical 99.999% for ammonia/methanol-grade output), turndown ratio (most large PEM stacks now rated 10–110% of nameplate), and the rectifier transformer duty (typically 6–12 kV primary, 0–800 V DC secondary with IGBT front-end).
The 6.5 MW Envision turbine is the highest-MW unit specified for a single hydrogen project, beating the 5 MW class that dominated the 2023–2025 NEOM design freeze [S7].
Standards, Hydrogen Purity and Safety Boundaries
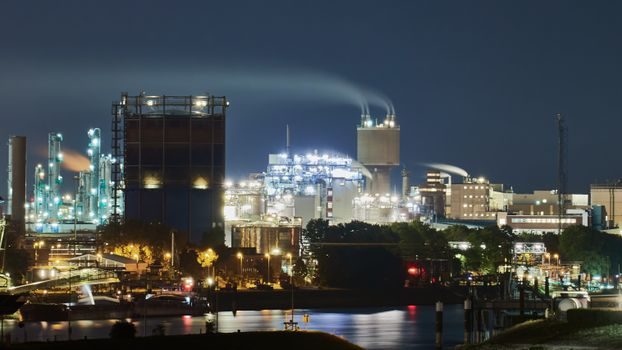
Green-hydrogen output is gated by ISO 14687 Grade D for fuel-cell mobility and by the more relaxed merchant-grade spec (≥99.9%) for ammonia and methanol synthesis. ISO 22734 covers the electrolyzer stack safety case, and IEC 60079-10-1 governs area classification around the rectifier/inverter hall where the BoP sits. Stack-area flammable-gas detection — typically 0–100% LEL H₂ IR sensors — interfaces with the safety PLC and is now specified as a separate SIL-2 loop distinct from the process control system. [S1]
Selection by end-use is straightforward: mobility and refueling demand ISO 14687 Grade D; ammonia/petrochem demand merchant spec only; merchant-captive buyers tolerate up to 2% N₂ and 1% O₂ at the battery limit. Where projects go wrong is feeding a fuel-cell-grade spec into a process-grade design — the PSA cost delta alone can run 15–20% of the BoP, before you count the catalyst volume required to hit the 99.999% line [S2].
Project Cost Benchmarks and Capex Envelope
Green-hydrogen capex for 2026 utility-scale builds is clustering in the $1,800–$2,500 per kW-installed range for the electrolyzer block, plus roughly $700–$1,100 per kW for the dedicated renewable island. Duqm's $4.2 billion phase-1 envelope covers both, with phase-2 output still to be released [S3]. Allied Market Research sizes the global green-hydrogen addressable market at $2.5 billion in 2022 and projects $143.8 billion by 2032 (50.3% CAGR 2023–2032) — a forecast that, if it lands, would imply >100 GW of cumulative electrolyzer additions worldwide [S4].
For sourcing, three levers shift the bid most: stack-volume commitments (multi-GW frames have moved $/kW down by 18–25% versus single-project quotes), rectifier-transformer sourcing (8–12 month lead-time for the 0–800 V DC class), and the wind/solar overbuild ratio (typically 1.4–1.6× electrolyzer nameplate to honour 90% availability). Process-engineer readers will recognise the 1.4–1.6× ratio as the same overbuild margin used in pressure transmitter loop-supply sizing — same idea, different unit.
Instrumentation and Control: Where Specs Quietly Decide the Project
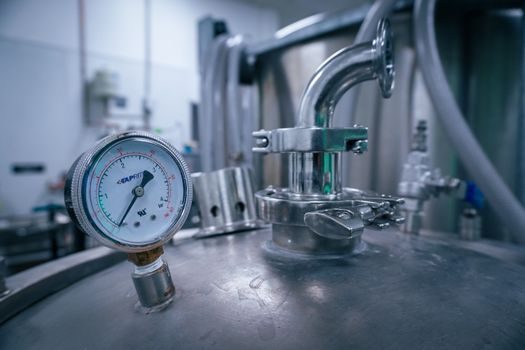
Electrolyzer-hall pressure, differential pressure across the PSA beds, and the H₂ mass flow at the battery limit are the three measurements that drive day-one operability. Hydrogen-duty flow meters for large-frame projects are now almost exclusively Coriolis at the battery limit (target turndown 1:100, accuracy ±0.5%) and thermal-mass at the cell stack vent (fast response, low pressure-drop). Differential-pressure transmitters on the pressure transmitter side are usually remote-seal dual-line designs with Hastelloy diaphragms to survive the wet oxygen side of the cell outlet. [S2]
Rectifier control uses a standard PLC layer with dedicated IGBT gate-drive modules; the safety PLC is separate and SIL-2 minimum for the hydrogen-detector trip chain. Cell-stack coolant flow is metered on flow meter lines sized for a 4:1 turndown to handle the start-up to full-load ramp. On the gas-side, isolation at the electrolyzer outlet is achieved through double-block-and-bleed industrial valve manifolds rather than single-valve designs, in line with ISO 22734.
Limitations, Failure Modes and Sourcing Risks
The dominant failure mode on a 2026 electrolyzer project is the rectifier and BoP, not the stack itself — typically 60–70% of unplanned downtime in year one traces to the rectifier/transformer or the PSA switchover, not to membrane degradation. Three concrete risks any spec engineer should price in: IGBT supply lead-times (40–60 weeks at the end of 2025), platinum-group catalyst cost volatility on the PEM side, and the limited qualified-vendor list for large-frame Coriolis flowmeters in hydrogen service. Allied Market Research's 50.3% CAGR forecast is also a long-duration, 2023-base number and should be read as a 10-year envelope, not a 2026 line item [S4].
Trackable signals worth watching through the rest of 2026: Envision turbine erection progress at NEOM Oxagon, the Duqm phase-2 FID outcome, and the SARCO/Ally Jazan equipment-hub vendor shortlist — all three will set the BoP supply map for the Gulf through 2028. The piece on PEMFC vs SOFC stack specs and 2026 sourcing levers covers the stack-side overlap if you're sizing the BoP around a fuel-cell load rather than an electrolyzer load.