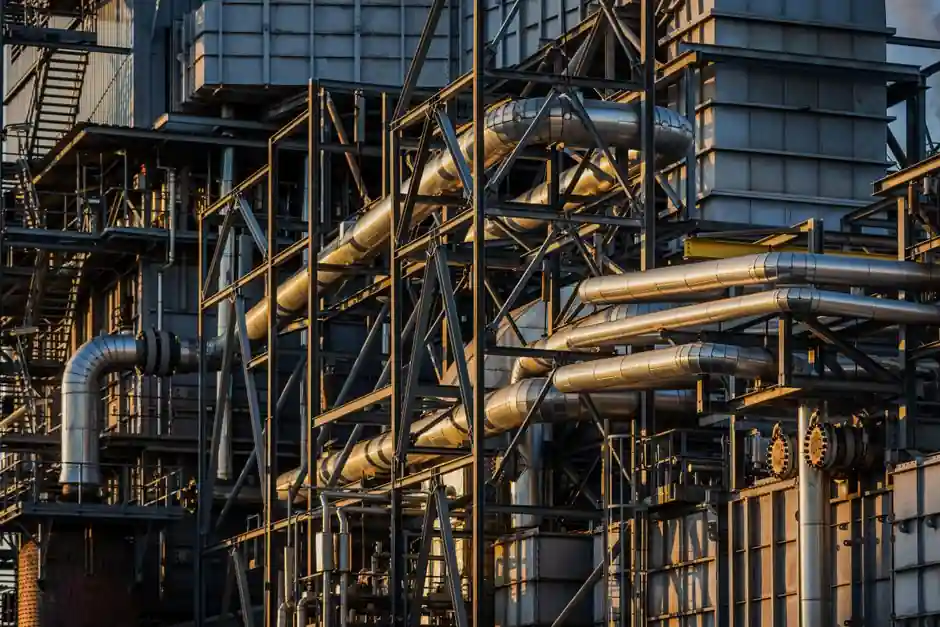
Battery energy storage is now a planning-grade grid asset, not a backup accessory, with global installed capacity moving from 0.54 TW in 2026 to 1.52 TW by 2031 at a 23.05% CAGR [S3].
Asia-Pacific held approximately 44.5% of the battery energy storage systems market in 2025, driven by rapid deployment of renewable energy [S2].
Top-line market shape: capacity, geography, and end-use mix
The headline market is large and accelerating: the global energy storage systems market reached USD 288.97 billion in 2025 and is projected to hit USD 602.84 billion by 2035 [S6]. A narrower battery-only cut puts the BESS market at USD 81.6 billion in 2026, compounding to USD 195.0 billion by 2036 at 9.1% CAGR [S4]. The discrepancy is scope, not contradiction: one series counts full systems plus services, the other counts the battery hardware stack.
Three structural slices define the 2026 picture. By technology, batteries hold 53.84% of the energy storage mix in 2025, with hydrogen-based storage forecast to grow at a 38.50% CAGR through 2031 [S3]. By connectivity, on-grid systems captured 93.26% of 2025 deployments, and off-grid is the fast lane at 31.35% CAGR [S3]. By application, grid-scale utility projects took 70.63% of 2025 market value, while EV-charging infrastructure expands at a 29.66% CAGR [S3].
Geographically, Asia-Pacific leads installed capacity with about 44.5% share in 2025; North America is the fastest-growing region at a 33.47% CAGR through 2031 [S2][S3]. Within Asia, India is the country growth leader at 11.5% CAGR, fed by solar-plus-storage buildout and peak-load demand [S4].
Manufacturer and integrator ranking: who is actually shipping
Cell and cell-integration leadership is concentrated, and the names repeat across independent trackers. Spherical Insights' 2026 top-20 list is led by Contemporary Amperex Technology Co. Limited (CATL), Tesla, BYD, Sungrow Power Supply, followed by LG Energy Solution, Fluence, and Wärtsilä [S5]. Mordor Intelligence places CATL at the front of LFP cell supply, with Tesla and BYD prominent in the home and commercial segments, Fluence and Wärtsilä dominant in time-sensitive grid contracts, and railway substations in India adding a new vertical [S3].
On the integrator side, Wood Mackenzie tracks global BESS system integrators by AC-based MWh shipped, and the 2026 report puts a short list of Chinese and U.S. players at the top, with vertically integrated cell makers able to undercut Western rivals by roughly 15% on turnkey prices [S8][S3].
Comparison of the main supplier profiles against three decision criteria, useful for sourcing and bid evaluation:
Cell-and-system integrators (CATL, BYD, Tesla, LG Energy Solution): they own the cell line and the pack assembly, so lead time on matching replacement modules is shortest; they are the only group with firm LFP cost-curve control after late-2025 cell pricing slipped to USD 70 per kWh, down from USD 115 a year earlier [S3].
Pure integrators and PCS specialists (Fluence, Wärtsilä, Sungrow): strongest in grid-services revenue stacking and ISO/RTO contracting; weaker on upstream cell cost control, so they are exposed when LFP cell prices swing.
Automotive OEMs entering storage (Ford Energy, launched January 2026): target data-center and grid-support applications; advantage is balance-sheet and plant reuse, disadvantage is no track record on long-duration duty cycles [S5].
What is driving the share shift in 2026

Three forces are bending the share curves. First, LFP cost compression: stationary-grade LFP cell prices fell to USD 70 per kWh in late 2025 from USD 115 a year earlier, pulling six-hour and eight-hour systems below natural-gas peaker LCOE in markets with peak-to-off-peak spreads above USD 40 per MWh [S3]. Second, policy stacking: the U.S. Inflation Reduction Act standalone storage ITC, EU RED III, and China's long-duration mandates each shift the regional demand balance and tilt cell-supplier selection [S3]. Third, the 2026 contracting wave: California utilities awarded 3.2 GW of six-hour contracts in 2025, and Texas ERCOT saw 2.1 GW of merchant storage reach commercial operation in 2025 [S3].
Application mix is rotating with these drivers. Grid services are projected to represent 38.9% of BESS application demand by 2036, utility-owned systems 46.2% of installed projects, and front-of-the-meter systems 63.4% of deployments [S4]. Large systems above 10,000 kWh carry 44.6% of capacity share, and lithium-ion holds 72.8% of deployed storage systems [S4]. For data-center buyers, pairing flywheels with batteries for sub-second power quality is a fast-growing niche, and the broader behind-the-meter build is feeding the energy management stack that operators now need to run multi-asset storage portfolios.
What this means for specifiers, EPCs, and asset owners
For utility and IPP buyers, the 2026 supplier map narrows to a defensible short list: CATL, BYD, and LG Energy Solution for cell supply; Tesla, Fluence, Wärtsilä, and Sungrow for full AC-block delivery [S5][S3]. The risk vector is not price; it is supply concentration, which the medium-concentration HHI band confirms [S9]. Dual-source strategies for cells and PCSs are now table-stakes on multi-hundred-MW builds.
For commercial and industrial buyers, the same supplier list applies but the metrics flip: warranty terms on cycle life, certified round-trip efficiency at the AC boundary, and the depth of the energy meter data feed become the deciding factors. For site integrators planning containerized BESS layouts, the choice of storage rack and storage cage architecture directly determines O&M access and module swap time, both of which are now scored in most long-term service agreements. Hands-on storage handling procedure, including the dock-to-inverter handoff for 10,000 kWh+ containers, is one of the most common sources of commissioning delay on tight 2026 schedules.
For new-build industrial facilities considering automation density, the same supplier-vendor question is mirrored in adjacent material handling decisions; see the polyurethane elastomer selection for energy equipment 2026 spec map for an analogous vendor-by-criteria layout used in energy-plant wear-component sourcing.
Limits of the available data and what to watch next
Three caveats temper the rankings. Vendor share splits between cell-only, module-only, and full AC-block integrators are reported inconsistently across trackers, so direct comparison of CATL's cell share and Fluence's integrator share on a single percentage line is not valid [S5][S8]. Off-grid and hydrogen storage forecasts carry wider error bars than the battery-only numbers because the 2025 base is small relative to the projected 2031 footprint [S3].
Two signals are worth tracking. First, Wood Mackenzie's 2027 integrator report, due early next year, will refresh the AC-based MWh shipped table and should clarify whether the 15% Chinese turnkey price gap is narrowing as U.S. cell capacity comes online [S8]. Second, the 2026 contracting cadence out of California (3.2 GW awarded in 2025) and ERCOT (2.1 GW reaching COD in 2025) sets a measurable baseline: if 2026 awards clear 4 GW in California and ERCOT merchant COD exceeds 2.5 GW, the top-five revenue band should migrate toward the upper 44% mark; if either slips, the lower 38% bound is the more defensible assumption for procurement planning [S3][S9].
Closing reference: for buyers cross-checking cell-supplier credibility against adjacent energy-equipment categories, the TOPCon solar cell market share by manufacturer 2026 snapshot uses the same vendor-by-criteria structure and pairs cleanly with this storage snapshot for combined solar-plus-storage sourcing reviews.