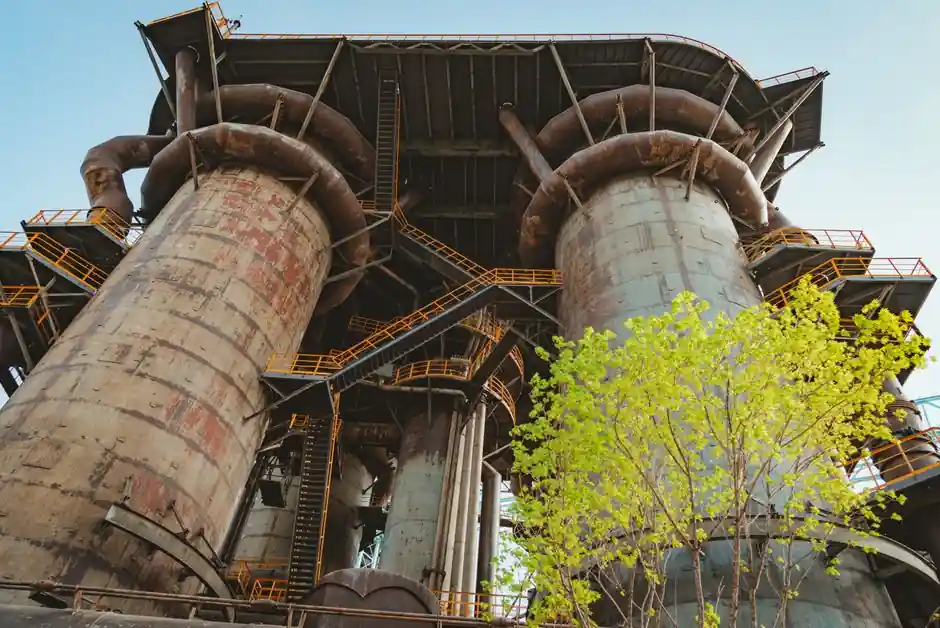
European chemical plant closures announced between 2022 and 2025 reached 37 Mt of cumulative capacity, roughly 9% of the continent's production base, while annual announced investment collapsed from 2.7 Mt in 2022 to 0.3 Mt year-to-date in 2025 [S1][S2]. The European Chemical Industry Council (Cefic) report, published 28 January 2026, ties the imbalance to high gas prices, weak demand and Chinese export pressure [S1].
Closures have been concentrated in upstream petrochemicals (17.8 Mt), basic inorganics (11.7 Mt), polymers (5.4 Mt) and specialty chemicals (2.0 Mt) [S1]. Roughly half of the petrochemical shuttering involves nine steam crackers, equal to a 16% net reduction in European steam-cracking capacity, all located in integrated chemical clusters [S1][S5]. For reference on what these clusters physically house, see this overview of a chemical batching plant (note: the term "chemical plant" covers a much wider asset base, but cluster infrastructure follows the same process-unit logic). The wider supply chain is now exposed: Cefic estimates 89,000 indirect jobs are at risk beyond the 20,000 direct roles already eliminated [S1].
Closure Geography: Germany and Netherlands Carry Half the Volume
Country-level announced capacity closures since 2022 break down as Germany 8.8 Mt (25%), Netherlands 7.2 Mt (20%), UK 4.5 Mt (12%), France 3.9 Mt (10%), Italy 2.5 Mt (7%), Belgium 2.3 Mt (6%) and Spain 1.6 Mt (4%), with the remaining 6.0 Mt (16%) spread across the rest of Europe [S1][S5]. Germany alone holds Europe's largest chemical industry by output, yet its 2022-2025 confirmed capacity investment of 0.8 Mt trails Belgium's 2.4 Mt and France's 0.4 Mt [S5].
The energy-cost driver is structural: Cefic attributes 49% of closure cases to lack of energy cost-competitiveness, 19% to weak demand, 9% to overcapacity and 8% to regulatory burden [S1][S5]. The remaining 15% is not itemised in the published breakdown, a gap worth flagging when reading the headline 49% figure. Cefic Director General Marco Mensink stated: "The sector is under severe stress and breaking. The rate of closures has doubled in a year, and even worse, annual investments are half and close to zero" [S1][S2].
Investment Collapse: CAPEX Falls From EUR 7.6 bn to EUR 1.5 bn
Confirmed European chemical CAPEX fell by a factor of five, from EUR 7.6 billion in 2022 to EUR 1.5 billion in 2025 (USD 9 bn to USD 1.8 bn at then-prevailing rates) [S5]. The 86% drop in announced investment capacity is steeper than the CAPEX figure because fewer projects are even reaching the announcement stage, and average project size has shrunk [S5].
Investment themes that did survive cluster around the battery value chain (EUR 1.9 bn, 14% of spend), emissions reduction (EUR 1.9 bn, 14%) and recycling (EUR 1.5 bn, 11%), but Cefic notes these categories follow the same downward trajectory as the rest of the sector [S1][S5]. The scale is mismatched against the 17.8 Mt of petrochemical capacity already slated for closure, since only 3.8 Mt of petrochemical investment is confirmed for 2022-2025 [S1]. A separate cycle overview reaches a similar conclusion from the demand side in Chemical Industry 2026 Cycle: Trough Confirmed, Recovery Uneven by Region.
Global Overcapacity: 222 Mt Surplus Across Six Building Blocks
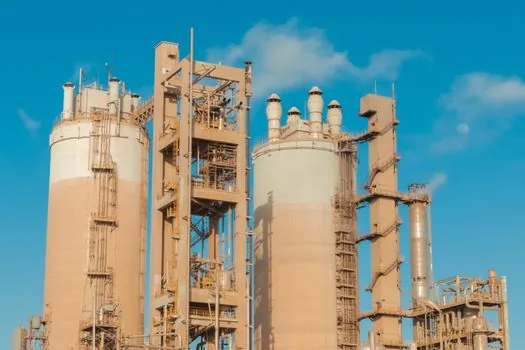
Outside Europe, ICIS forecasts global overcapacity in the six core chemical building blocks (ethylene, propylene, butadiene, benzene, toluene, xylenes, plus methanol in some readings) at 222 Mt in 2024, the highest level since records began in 1978, rising to 226 Mt in 2025 [S4]. China alone is forecast to add 18.7 Mt/year of capacity in 2024, equal to 81% of the global net increase that year [S4].
Chinese share of the six building blocks is projected to reach 38% of global capacity by 2030, against 23% of global ethylene capacity in 2024 [S4]. Chinese polypropylene exports rose from roughly 0.5 Mt in 2020 to 1.3 Mt in 2023, while net PP imports more than halved from 6.1 Mt to 2.8 Mt over the same window [S4]. The structural read-through for European producers is that high-cost swing capacity will be the first to be rationalised, which is consistent with the steam-cracker concentration noted above. Macro context on regional capex divergence is laid out in Chemical Industry 2026 Capex: Cuts in EU, Flat US, Growth Pockets in AI and Middle East.
Producer-Level Cuts: BASF, Dow, Eastman, Solvay, Celanese, LyondellBasell
BASF reported a 2.9% sales decline and 38.8% earnings drop in 2025, cut USD 2 billion in annual costs since 2023, and is targeting USD 2.7 billion by end-2026, alongside elimination of 11% of its senior executive layer and a 4,800-position workforce reduction; the company also sold a majority stake in its coatings business to Carlyle and Qatar Investment Authority [S3]. Dow Chemical booked a USD 657 million loss in January 2026, layered an additional 4,500-job cut on top of a prior 1,500-position program, and is targeting USD 2 billion in cost reduction [S3].
Eastman Chemical saw sales off 6.7% and earnings down 32.7%, with USD 100 million of 2025 cost cuts and a further USD 125-150 million planned for 2026; CEO Mark Costa noted that ex-data-centre, ex-AI and ex-healthcare, "GDP is sort of flat" and "eighty percent of our consumers out there are really struggling" [S3]. Solvay shed USD 235 million in annual costs over two years, closed peroxides plants in the UK and Portugal, and shut a trifluoroacetic acid unit in France, with sales down 9.0% and earnings off 31.2% [S3]. Celanese earnings fell 51.1%, it sold its Micromax inks business for USD 500 million, and is targeting USD 1 billion in total divestitures [S3]. LyondellBasell posted the steepest earnings decline at -72.4% on a 9.7% sales drop; DuPont was the outlier with sales up 1.9% and profits up 31.2% on healthcare and water strength [S3]. The pattern of solvent and base-chemical supply tightening from these moves is what drives longer lead times at the chemical reagent and chemical material tiers of the distribution chain.
What Buyers and Specifiers Should Track
Closure announcements of this scale translate into four operational signals for downstream buyers: longer lead times on commodity solvents and base chemicals as capacity comes offline, product discontinuations as non-core lines are exited, pricing volatility as reduced supply meets uneven demand, and sourcing shifts as producers divest or consolidate [S3]. Single-source dependencies on a steam-cracker derivative or a specific peroxide grade are now the highest-risk positions to audit.
Selection criteria for new supplier qualification under these conditions should include: site diversification across at least two of the still-operating clusters in Germany, Netherlands, Belgium and the US Gulf; written confirmation of contractually reserved capacity rather than spot allocation; and safety-of-supply clauses tied to feedstock index, since 49% of European closures were energy-cost driven and that exposure can re-open if gas prices move [S1][S3]. Engineering specifications on flow and pressure instrumentation at replacement or new-build sites should also be reviewed for any pressure transmitter and flow meter tied to retired asset classes, since re-spec opportunities open as plants restart under different ownership.
Limitations of the Closure Data Set
The 37 Mt cumulative figure is announced capacity, not realised or fully executed closure tonnage, so actual nameplate removal is lower once delays, partial curtailments and idle-with-reopen options are netted out. The country split also mixes announced with confirmed: Germany 8.8 Mt and Netherlands 7.2 Mt are announced closures, while the 2.4 Mt / 0.8 Mt / 0.4 Mt investment figures for Belgium, Germany and France are separately confirmed CAPEX, and the two columns are not directly comparable [S1][S5].
Overcapacity numbers from ICIS are model-based forecasts rather than measured output, and the 222 Mt 2024 / 226 Mt 2025 surplus is sensitive to Chinese operating-rate assumptions that ICIS itself flags as uncertain [S4]. The reason attribution (49% energy, 19% demand, 9% overcapacity, 8% regulation) is Cefic's member-survey read of stated rationale, not an independent causal decomposition, so overlapping cases (e.g. a site that is both energy-uncompetitive and demand-weak) may be double-counted across categories [S1][S5].
Trackable signals for the next 6-12 months: Cefic's H2 2026 Closures and Investments Radar update, BASF's full-year 2026 results versus its USD 2.7 billion cost target, Dow's progress on the second 4,500-position cut tranche, and any restart or mothball reversals at the nine named steam crackers once gas-price forward curves stabilise [S1][S3]. Linked chemistry-side context on how this overcapacity cycle compares with demand-region trajectories is in Chemical Industry 2026 Cycle: Trough Confirmed, Recovery Uneven by Region.