The cathode is the largest single cost contributor inside a lithium-ion EV cell as of the September 2024 component split, with separators, electrolyte, and anode materials forming the next three cost blocks in descending order [S1].
Global EV battery market value is projected at USD 103.04 billion in 2026, expanding to USD 168.95 billion by 2035 at a 5.6% CAGR, while lithium-ion retains a 98.6% share of that market in 2026 [S2]. Asia Pacific accounts for USD 43.54 billion in 2025 and is forecast to reach USD 138.18 billion by 2035 at a 12.2% regional CAGR [S2].
Component-Level Cost Stack: Where the Cell-Spend Goes
The September 2024 component split of lithium-ion cell cost places cathode active material at the top of the bill of materials, followed by the separator, electrolyte, and the anode [S1]. For a process engineer sizing a new gigafactory, that ordering dictates which upstream lines must scale first: precursor and CAM synthesis upstream of coating, dry rooms calibrated to separator moisture specs, and electrolyte tank farms sized to the planned GWh output.
Material type remains a primary cost lever because cathode chemistry choice — NMC, NCA, LFP, or sodium-ion — directly sets the $/kWh baseline before cell format even enters the equation. LFP cells reduce cathode material cost per kWh but trade energy density; sodium-ion platforms, which MarketsandMarkets flags as a growth opportunity for affordable EV segments, sit below lithium-ion on $/kWh but with lower specific energy [S2]. Specifying a cell format (prismatic 8.4% CAGR lead, pouch, cylindrical) and chemistry together is the single biggest decision a sourcing team makes on cell cost [S2].
Cost Driver Ranking: Chemistry, Form Factor, Capacity, and Lead Time
Cost drivers do not act independently. They stack: cathode chemistry choice sets the per-kWh material floor; cell form factor (prismatic, pouch, cylindrical) sets the pack-level integration cost; battery capacity band sets the validation and homologation cost; and lead time from CAM supplier to cell line sets working capital cost. [S2]
Among the three dominant form factors, prismatic cells are projected at the highest 8.4% CAGR through the forecast window — a signal that pack-level manufacturability and rectangular pack density are outweighing cylindrical's thermal-management advantages in new platforms [S2]. For commercial vehicle and LCV platforms — projected as the fastest-growing vehicle-type segment — the prismatic form's volumetric efficiency and module-to-pack architecture typically win on $/kWh at the system level. Cylindrical formats retain the edge where high C-rate and proven thermal propagation behaviour dominate the spec.
Decision Matrix: Who Should Pick Which Format and Chemistry

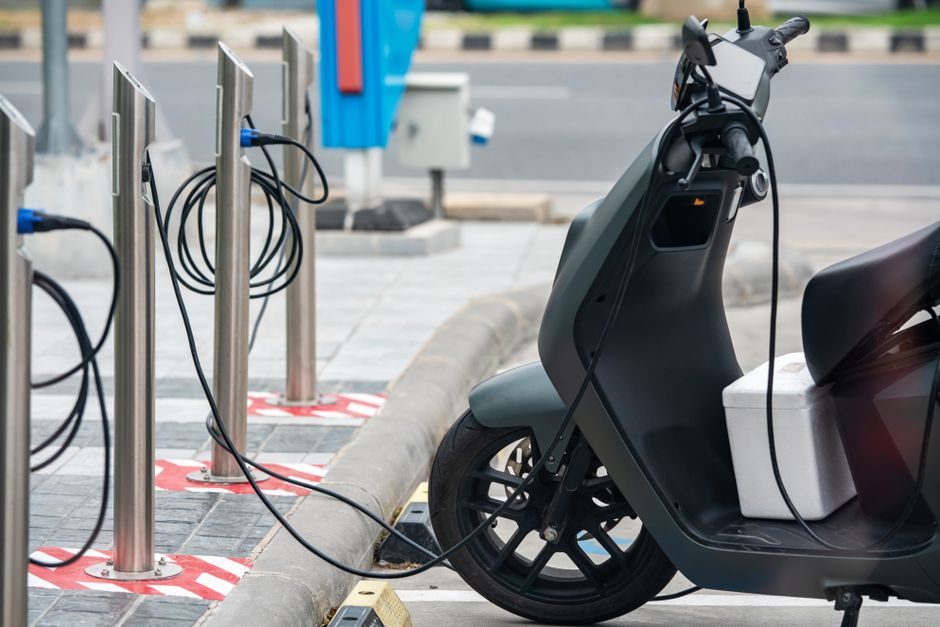
Premium BEV passenger cars targeting >300-mile range and high peak charge rate usually pair high-nickel NMC cathodes with cylindrical 4680-class cells or large-format pouch, accepting higher $/kWh for energy density. Mass-market passenger EVs and LCV fleets converge on LFP prismatic cells for cost-down, accepting lower energy density and warmer operating profiles. Entry-level urban and two-wheeler segments can move further down the cost curve toward sodium-ion once commercial cell volumes arrive [S2].
Process engineers specifying equipment for these lines should anchor line sizing decisions on the cell format share targets rather than legacy benchmarks. Prismatic lines require large-tonnage stacking and stacking-alignment stations, pouch lines require vacuum-forming and formation cycling capacity, and cylindrical lines require high-speed winding and laser welding. The choice of pressure sensor and flow meter classes for electrolyte dosing and dry-room atmosphere control follows from the format choice, not the other way around.
Total Cost of Ownership: Beyond the Cell Purchase Price
Cell purchase price is roughly half the conversation. Total cost of ownership for an EV battery system adds the pack enclosure, BMS hardware, thermal management loop, module-to-pack integration labour, end-of-line formation cycling energy, warranty reserve per kWh, and residual value recovery. The MarketsandMarkets outlook flags structural battery designs, high-voltage 800 V architectures, and software-defined battery management as the levers that compress pack-level $/kWh in 2026-2035 [S2].
Recycling and second-life economics enter the TCO model from the back end. Localised cell manufacturing, battery recycling, and raw material processing investments are listed as the supply-chain resilience moves that will shape 2026-2035 unit economics [S2]. For a procurement team modelling 5-7 year spend, working capital tied to CAM inventory, formation cycling electricity cost, and warranty burn-rate per platform are the variables that move the IRR more than headline cell price does — a similar spend-stack pattern to other industrial capex such as the slewing ring bearing TCO model.
Limitations, Failure Modes, and Sourcing Constraints
The component-share data is a global average from September 2024 and will shift as LFP gains share in mass-market segments and sodium-ion enters the low-end mix [S1][S2]. Spot lithium carbonate and nickel sulphate prices are the highest-variance inputs and can swing the cathode cost block by double-digit percent quarter to quarter — a risk that argues for indexed contracts or vertically integrated CAM supply on multi-year programmes.
Lead time on dry-room-grade HVAC, electrolyte-grade solvents, and formation cycling power supplies remains the operational bottleneck, not cathode precursor chemistry. Specifying industrial valve and PLC packages for solvent handling and dry-room pressure cascades follows the same vendor-qualification timeline as the cell line itself. For a process engineer auditing a new gigafactory plan, the EV battery production capacity line-sizing model provides the matching upstream sizing framework.
Standards, Sourcing Signals, and Trackable Next Nodes
Trackable signals for the next two quarters: LFP vs NMC cathode share split in 2026 cell output, sodium-ion commercial cell shipment volumes, and 800 V structural pack announcements tied to prismatic form factor wins [S2]. Procurement teams should also watch precursor-cAM vertical-integration announcements from CATL, BYD, and LG Energy Solution, which the MarketsandMarkets report flags as the dominant capacity expansion players [S2].
For process engineers and sourcing leads, the working baseline is: cathode-led cost stack, prismatic form factor gaining share at 8.4% CAGR, lithium-ion dominant at 98.6% of 2026 volume, and the next cost-down wave coming from structural pack design and sodium-ion entry-level platforms rather than incremental lithium-ion cell price compression [S2].