
BNEF's 2026 outlook puts global passenger EV sales at 23.3 million units in 2026, an 11% year-on-year rise, with road transport still the single largest source of lithium-ion battery demand even as the curve flattens [S4].
Grand View Research sizes the EV battery market at USD 72.9 billion in 2026 and projects USD 198.86 billion by 2030, a 22.2% CAGR over 2025-2030, with stationary storage and grid services now absorbing a meaningful share of new cell output [S1].
Demand baseline: 1 TWh in 2024, more than 4x by 2030
Total rechargeable battery demand hit a historical 1 TWh in 2024 and could more than quadruple from 2023 levels by 2030, per CSIS analysis of the U.S. battery buildout, with lithium-ion displacing legacy lead-acid as it lifts from roughly 10% of U.S. production in 2013 to nearly 90% by 2022 [S3].
Road transport still drives volume, but BNEF flags that weakening passenger EV sales in some major markets plus the rising share of plug-in hybrids and range-extenders, which use smaller packs than battery-electric vehicles, are pulling average kWh-per-vehicle down. Stationary storage, including grid-scale and behind-the-meter, is now the offsetting demand source, and major OEMs including GM, Ford, and Volkswagen are explicitly redirecting new cell capacity toward energy storage systems, especially in the U.S. [S4].
CSIS notes that downstream cell assembly has grown faster than midstream inputs (cathode/anode materials, foils, separators) and that upstream mineral processing remains the structural bottleneck, with full self-sufficiency unlikely even with aggressive policy support [S3].
Cell price trajectory: $161/kWh peak to $80/kWh by 2030
E Source's forecast tracks automotive cell prices from $132/kWh in 2018 to a 2021 high of $161/kWh, then a decline to an estimated $80/kWh by 2030, crossing the sub-$100/kWh parity-versus-gasoline threshold around 2025 [S2].
The same model expects recycled lithium-ion to represent 11% of supply by 2030, with material impact on the supply chain beginning around 2027, a relevant data point for cell makers sizing recycled-content procurement [S2].
For process engineers specifying forming and pack-assembly lines, the price curve matters more than the headline market value: a halving of cell cost over the decade reshapes which throughput numbers justify capex, and it directly compresses the unit-economics buffer that funded 2022-2024 gigafactory buildouts.
Regional divergence: the U.S. policy reset
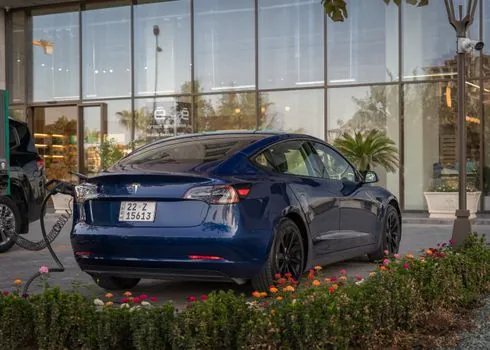
CSIS, writing in April 2026 after the OBBBA framework took effect, projects U.S. EV sales in 2030 running as much as 44% (roughly 14 million units) below pre-OBBBA industry forecasts, a delta large enough to reshape U.S. cell-pack capacity utilization [S3].
BNEF's 2026 outlook lists Mexico and Spain as newly tracked core markets alongside the U.S. (with a California breakout), China, Japan, India, Canada, South Korea, Australia, Germany, the U.K., France, Italy, Brazil, the Nordics, and Southeast Asia, reflecting how geographic exposure is now a primary risk variable for cell suppliers [S4].
Allied supply chain coordination is emerging as the U.S. response, with investors, operators, suppliers, and customers concentrated in partner economies; CSIS frames indiscriminate decoupling as counterproductive relative to managed de-risking [S3].
Comparison: passenger BEVs vs PHEVs/EREVs vs stationary storage
Across the three demand pools an engineer should plan capacity against, the trade-offs for 2026-2030 are clear. Battery-electric passenger cars deliver the largest pack size per unit (typically 60-100 kWh) and the strongest volume signal in China and Europe, but BNEF shows the segment growing more slowly than 2024-era models projected [S4].
Plug-in hybrids and range-extender EVs use materially smaller packs and are gaining share where charging infrastructure lags, which lifts unit shipments but lowers MWh per vehicle, a structural drag on total TWh growth even as sales rise [S4].
Stationary storage, by contrast, takes whatever cells the cell-makers redirect toward it, with GM, Ford, and Volkswagen publicly building storage pipelines alongside EV programs; this is the channel that absorbs the capacity overhang when passenger-EV forecasts slip [S4]. For a deeper view of cell chemistry and supplier tiers behind this split, see the Lithium Battery Competitive Landscape 2026 coverage, and for the price-GWh crossover specifics, the Lithium Battery Demand 2026 to 2030 breakdown lays out the per-segment forecast bands.
Manufacturing footprint: 2026 capacity buildout and what it implies for equipment

Nordson's 2026 manufacturing roundup frames the year as one where EV battery production remains the volume driver while stationary storage pulls forward capex, and notes that new cell capacity is being reallocated toward energy storage systems, particularly in the U.S., as automotive line utilization adjusts to slower passenger-EV growth [S5].
For electrode coating, calendaring, and formation equipment buyers, the practical read-through is dual-channel: automotive lines are being right-sized for higher-nickel and LFP chemistries, while a parallel storage build is pulling additional formation-and-aging capacity, with electrolyte and separator suppliers also exposed to the mix shift, as covered in Battery Electrolyte Market 2026: Volumes, Chemistries, and the Squeeze on Formulators [S5].
For plant-level controls, the 2026 shift toward storage lines also elevates demand for instrumentation that handles wider state-of-charge windows and longer cycle-life service, including pressure transmitter and flow meter selections rated for the higher-cycle-duty electrolyte circulation loops that stationary cells require.
Limitations and failure modes in the forecast
Three caveats apply to every 2026-2030 EV battery demand model in circulation. First, average pack size is not stable, BNEF's own outlook attributes the slower demand growth to rising PHEV/EREV share, so any forecast that assumes constant kWh-per-vehicle will overstate TWh [S4].
Second, policy is the single largest swing variable, CSIS documents a 44% downward revision in U.S. 2030 EV unit sales after OBBBA, and that magnitude of revision can repeat in any jurisdiction that revisits subsidies or tariffs between now and 2030 [S3].
Third, midstream inputs remain the binding constraint, with cathode/anode materials, foils, and separators lagging cell-assembly expansion, so even a bullish TWh forecast can be capped by what those midstream suppliers can physically deliver [S3]. Battery management systems also sit on the critical path for both automotive and storage pack delivery, and the BMS Market 2026 coverage traces how wireless, AI diagnostics, and EU digital-passport requirements are reshaping spec sheets in parallel with the demand shift.
Closing trackable signals: BNEF's 2026 outlook and CSIS's April 2026 post-OBBBA analysis both name stationary storage as the swing demand pool through 2030, while Grand View's USD 198.86 billion 2030 figure depends on the 22.2% CAGR holding, a level that any major market policy revision can break [S1][S3][S4]. Watch the next BNEF EVO update for revised kWh-per-vehicle and TWh bands, and the next CSIS policy note for any follow-on U.S. capacity-utilization revisions, as those two documents will tell you whether the 2030 numbers still hold.
For component-level specifications, see industrial valve.