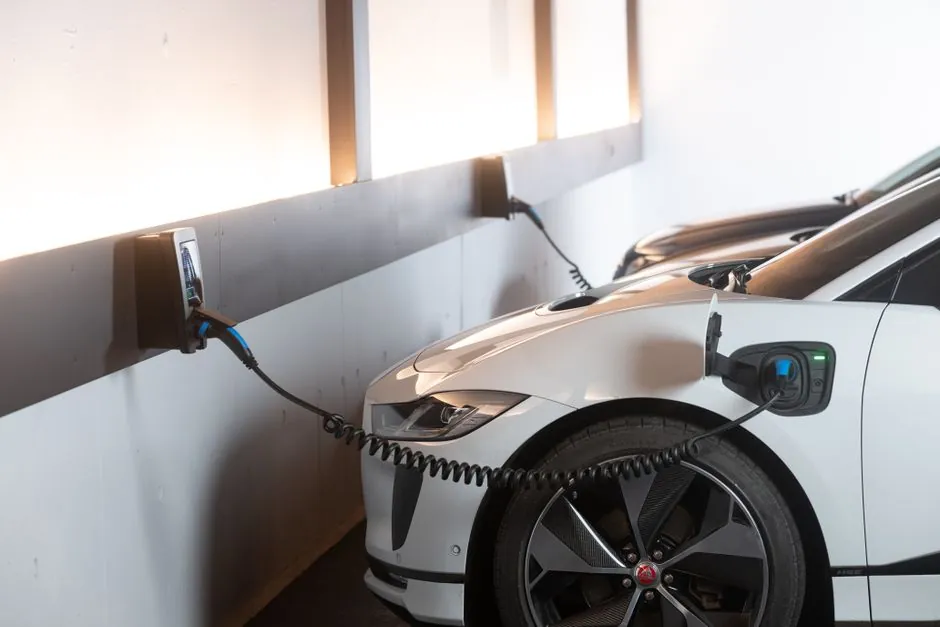
Global charging infrastructure revenue sits at US$50–66 billion in 2026 and tracks to US$239–493 billion by 2033–2035, an implied 16–22% CAGR across leading analyst forecasts, with 6.7 million public connectors already deployed worldwide and 23 million EVs expected to roll off dealer lots in 2026 [S3].
Behind that headline sit three very different regional curves: India at a 27.67% CAGR on a USD 0.49 billion (2025) base toward USD 1.65 billion by 2030, Europe compounding from USD 41.54 billion (2025) to USD 56.59 billion (2026) on its way to a much larger 2034 endpoint, and a United States market in policy whiplash after the September 30, 2025 repeal of federal EV purchase credits under the One Big Beautiful Bill Act [S1][S2][S3].
Global Volume Baseline: 20 Million EVs in 2025, 23 Million in 2026
Global electric car sales passed 20 million units in 2025, equivalent to roughly one in four new cars sold worldwide, with 2026 forecast at 23 million units or 28% of new-car sales and Europe delivering the largest year-on-year growth at about +20% [S3]. BloombergNEF counts 6.7 million public connectors deployed globally as of 2026, up 19% year-on-year, against that sales base [S3]. The structural read is that infrastructure demand is no longer gated by EV adoption, it is gated by which charging architectures, certifications, and tariff-compliant supply chains operators can lock in before 2030 [S3].
The IEA benchmark of approximately 10 electric cars per public charger is the ratio that frames utilisation economics, and only leading markets such as the Netherlands approach it; most regions still sit well above that line, which is the gap that hardware orders and EPC contracts are racing to close [S2].
India: 27.67% CAGR, 1.32 Million Stations Required by 2030
India's public EV charging station count grew from 5,151 (December 2022) to roughly 29,000+ (August 2025), a near sixfold expansion in under three years, and the CII estimates the country needs 1.32 million charging stations by 2030, requiring about 400,000 new installations per year [S1]. DC fast chargers hold a 63.7% revenue share of the Indian market, the dominant segment, with Karnataka leading state deployment at 6,097 stations and Tier-3 / non-metro areas (12,040 chargers) now exceeding Tier-1 cities (9,702 chargers) [S1].
The policy-to-execution gap is sharp: under FAME-II, 9,332 chargers were sanctioned but only 6,645 were operational by March 2026, a 71.2% operationalisation rate, while the PM E-DRIVE scheme targeted 72,000 stations with INR 2,000 crore and had recorded zero expenditure as of March 2026 [S1]. Tata Power leads incumbent deployment at 6,700+ public and fleet charging points across 630+ cities, with oil-marketing companies holding the forecourt slot: IndianOil 13,614 chargers, BPCL 6,563, and HPCL 5,400+ [S1]. For the upstream side of vehicle electrification, the EV traction motor outlook through 2030 is a useful complement to charger planning, and the EV traction motor demand trajectory tracks the same automotive volume curve.
Europe: 150 kW Every 60 km, 3.5 Million Public Points by 2030
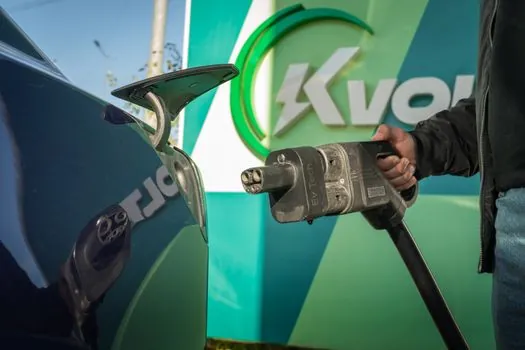
The EU Alternative Fuels Infrastructure Regulation (AFIR) mandates fast chargers of at least 150 kW every 60 km along the core trans-European transport network by 2025, and requires member states to deliver 1 kW per battery-electric car and 0.66 kW per plug-in hybrid car registered [S2]. The European Commission estimates roughly 3.5 million public charging points will be needed by 2030 to support a projected fleet of 30 million zero-emission vehicles, against a 2023 base of 632,423 publicly accessible charging points in the EU, a year-on-year growth rate of approximately 35% [S2].
Funding is matched to the mandate: the Connecting Europe Facility has allocated EUR 1.5 billion specifically for alternative-fuel infrastructure including high-power charging corridors, and the Fit for 55 package links infrastructure roll-out to carbon reduction targets, so the regulatory floor for AFIR-compliant deployment is concrete, not aspirational [S2]. The Europe market, valued at USD 41.54 billion in 2025 and an estimated USD 56.59 billion in 2026, is forecast to reach USD 671.31 billion by 2034 at a 36.23% CAGR, a far steeper curve than the global aggregate because ultra-fast HPC, depot charging, and truck MCS are concentrated in Europe [S2].
Hardware Cycle: 1000 V, Liquid-Cooled HPC, MCS, and NACS
The 2026–2030 hardware cycle is defined by 800–1000 V vehicle platforms, sub-10-minute charging sessions, 600 kW+ liquid-cooled high-power chargers, megawatt charging (MCS) for trucks, NACS (SAE J3400) connector consolidation, V2G commercialisation, and BESS-plus-solar hybrid hubs [S3]. Certification under UL, CE, and TUV schemes is now a market-entry requirement rather than a marketing badge, because HS Code 850440 (static converters, including EV chargers) is treated as a geopolitical trade category: US Section 301 duties sit at 25% on components and 100% on Chinese-origin EVs, with EU countervailing duties stacking on top, and roughly US$36 billion of annual Chinese charger exports re-routed through origin/compliance review [S3].
For operators sizing equipment on a per-site basis, the same instrumentation discipline used in adjacent industrial builds applies: a pressure transmitter spec map is a useful cross-reference for site-side instrument selection, while the broader BESS-plus-solar integration pattern is reshaping how battery pack production lines are being specced into stationary storage as well as EV packs.
Policy Divergence: Germany Restarts, US Repeals, Mexico Builds
Germany signed a coalition agreement in October 2025 that unlocked a EUR 3 billion EV incentive package, launched January 2026, offering EUR 1,500–6,000 for low- and middle-income buyers, and Germany's BEV new-car share rebounded to 25.8% in April 2026 [S3]. The United States took the opposite path: the One Big Beautiful Bill Act of July 4, 2025 repealed federal EV purchase credits for vehicles acquired after September 30, 2025, and NEVI federal charging funds were frozen then partially restored under revised guidance in August 2025, leaving only about 550 NEVI-funded fast-charging points operational across 19 states by April 2026 [S3].
Mexico is the surprise growth lane: electrified vehicle sales grew 38% in 2025 to 96,636 units (cumulative 235,501 by Q1 2026), but only 4,378 public charging points exist nationwide, and the Olinia domestic-EV programme under Plan México targets 2,000 charging stations by 2027 [S3]. For spec-heavy industrial buyers, flow meter selection criteria for site utilities, industrial valve classes for coolant loops on liquid-cooled cabinets, and eye wash station placement at high-power charging depots are all governed by the same standards discipline that drives NEMA 4X enclosure and NFPA 70E siting rules for the cabinets themselves.
Selection Criteria: Architecture, Certification, and Capex per kW
Three decision criteria separate winning 2026–2030 charging hardware from the rest: peak power class (50–150 kW urban DC vs 350–600 kW corridor HPC vs 1 MW+ MCS for trucks), certification stack (UL 2231, UL 2202, CE RED, TUV Rheinland, and SAE J3400 NACS for North America), and capex per kW including grid interconnection, BESS augmentation, and liquid-cooling skid cost [S3]. Operators are increasingly specifying Ethernet-APL or 4G/5G OCPP 2.0.1 backhaul with ISO 15118-20 plug-and-charge, and pairing chargers with a total station-style site-survey workflow for greenfield depots where cable trenching, transformer siting, and stormwater routing all have to clear on the same plan.
Buyers should weigh three options: (1) 50–150 kW urban DC, lower capex per kW, suited to retail and fleet depot duty cycles with 30–60 minute dwell times; (2) 350–600 kW liquid-cooled HPC, higher capex per kW but critical for corridor economics under AFIR's 150 kW / 60 km mandate; (3) megawatt MCS for truck and bus duty cycles, justified only on dedicated logistics corridors where dwell time and per-kWh revenue both support the premium. The downstream enabler, whether European AFIR compliance, US NEVI replacement funding, or Indian state tender pipelines, is now the binding constraint, not the hardware itself [S1][S2][S3].
Trackable signals through end-2026: the next NEVI funding revision under revised August 2025 guidance, the rollout pace of Tata Power's 6,700+ point network against the TATA.ev 400,000-point 2027 target, and the publication of the EU's 2026 member-state compliance reports against the 3.5 million-point 2030 mandate.