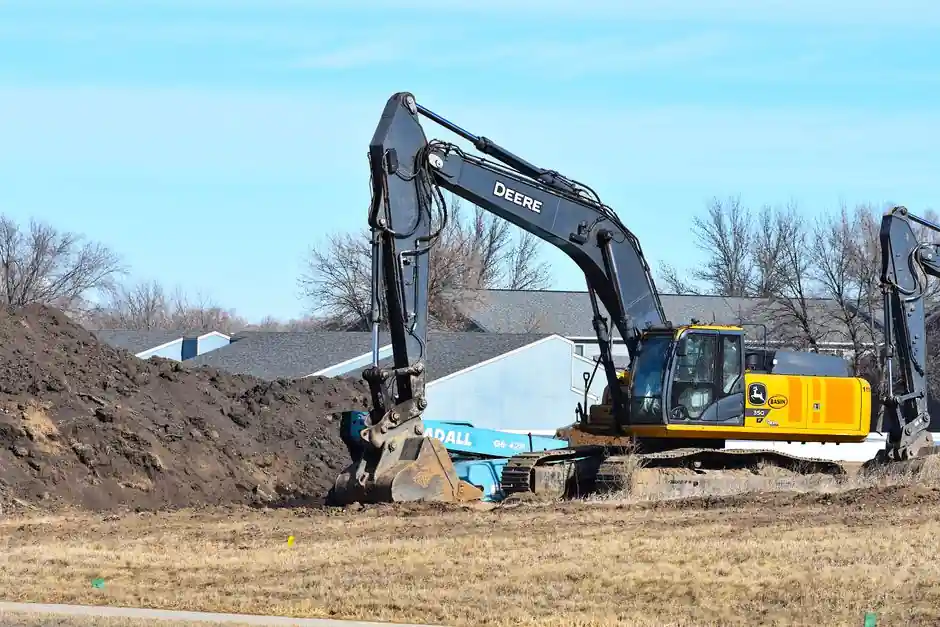
Excavator rated lift capacity scales with operating weight but not in a 1:1 line, with a 1.5-ton class mini typically rated 500-750 kg and a 3-ton class reaching 1,000-1,360 kg per published model data [S4]. Real capacity at any given moment is set by reach, blade position, attachment weight, and the manufacturer's lift chart rather than by the machine's nameplate class [S1][S2].
Lift charts are mandatory on any excavator configured to suspend freely hanging loads, and they are produced by sweeping the load through a height-radius grid on a 1 m step until either the hydraulic or the stability limit is reached [S3][S5]. Working outside the published chart is treated as a stability violation under Australian OHS Regulations 2017 and similar frameworks elsewhere [S5].
Why Operating Weight Alone Misleads
Caterpillar lists four variables that bound excavator lift capacity: machine weight, center of gravity, lift point position, and hydraulic capability, with the lowest of those setting the working limit [S6]. Two 6-ton excavators from different vendors can therefore carry very different loads at the same radius because the counterweight, track gauge, and pump relief settings differ, even when their operating weights on the spec sheet are within a few percent [S1].
Wacker Neuson confirms the rule of thumb directly: lift capacity rises with operating weight, but the conversion is conditional on model, ground conditions, and whether the dozer blade is up or down [S2]. The relationship is closer to a power-law than linear, because the stability margin depends on the tipping-moment balance between the load moment and the reaction at the tracks, not on the mass ratio itself.
What the Numbers Look Like by Class
Mini-excavator lift capacity spans three orders of magnitude inside the compact class. A 1.5-ton class machine is commonly rated 500-750 kg, a 3-ton class 1,000-1,360 kg, and the broad compact excavator market runs from roughly 2,000 lb (0.9 t) at the smallest up to about 20,000 lb (9 t) at the upper end of the compact segment [S4][S8]. Mini-excavators overall are described as lifting anywhere from a few hundred kilograms to several tons, with the actual figure driven by the model's lift table [S2].
For a quick read across the size ladder, the published figures align roughly as: 1.5 t class: 500-750 kg, 3 t class: 1,000-1,360 kg, 5-6 t class: roughly 1,500-2,500 kg of nameplate lift at the most favorable radius, and 8-9 t class compact machines at the upper end of the segment [S4][S8]. Outside the compact range, the same scaling continues but with larger stability envelopes, wider track gauges, and heavier factory counterweights that let the rated chart extend further in front and over the side.
How the Lift Chart Is Actually Built
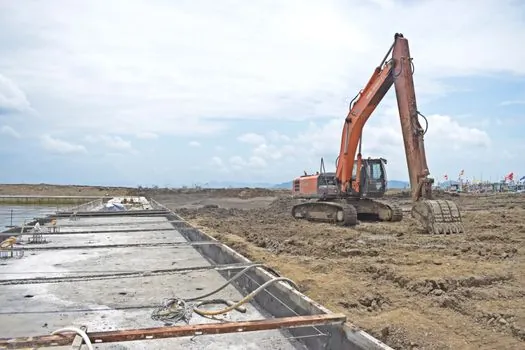
Bobcat's test procedure, published by Dewesoft, shows the methodology that most compact-excavator OEMs follow: the lift capacity is measured to ISO 10597 by loading each machine position to its limit at a 1 m height and radius step, repeating each point three times, and recording whether the limit reached was hydraulic or stability [S3]. The test runs in three machine positions: over the blade with blade down, over the blade with blade up, and over the side with blade up, and the smallest value at each grid cell is what becomes the published rating [S3].
That procedure matters to a buyer because two of the three positions (blade up and over the side) are the conservative entries on the chart, and they are typically 30-50% below the favorable blade-down reading. A common procurement mistake is to quote the over-blade-down figure from the brochure and then load the machine at full reach over the side, which is the configuration the chart flags first [S3][S6].
Reach and Arm Length: The Hidden Multiplier
Stnd Machinery summarizes the trade-off cleanly: longer arms extend the working envelope but cut lift force at any given radius, while shorter arms trade reach for raw capacity at close range [S7]. According to Wacker Neuson, the farther a load is from the pivot point the greater the leverage and the sooner the machine reaches its stability limit, which is why manufacturers publish lift-capacity tables that specify capacity at varying boom positions and radii [S2][S7].
Quick-coupler weight compounds this effect. A standard quick coupler adds 30-80 kg and shifts the lift-point geometry forward, while a heavier hydraulic coupler can subtract 100 kg or more from the rated chart at maximum reach [S2]. The right workflow is to subtract the actual installed coupler mass and any attachment from the published chart before dispatching the machine on a lift, rather than treating the chart as a fixed asset.
Selection Map: When Operating Weight Predicts Lift, and When It Doesn't

For utility trench work, pipe handling, and repetitive lifts at short radius, operating weight is a strong predictor: the chart at 3 m radius is dominated by machine mass and the chart usually tracks weight class to within 10-15% [S4][S6]. For 360-degree lifts over the side, with long-stick configuration, or with heavy attachments, operating weight is a weak predictor and the published side-up chart must be read directly [S3][S7].
A short decision matrix for compact class selection: at 1-2 ton class, plan for 300-500 kg at 3 m radius and side-up, no lifting over personnel; at 2-3 ton class, plan for 700-1,000 kg at 3 m radius, short stick preferred; at 3-5 ton class, plan for 1,200-1,800 kg at 3 m radius, with the blade down on every lift; at 5-9 ton class, plan for 2,000-3,500 kg at 3 m radius and budget for a heavy counterweight option if the duty cycle needs side-up [S4][S8].
Standards, Compliance, and What Operators Must See in the Cab
Australian OHS Regulations 2017 require that any plant used to lift or suspend a load must be specifically designed for that load, fitted with appropriate lifting attachments, and operated within its safe working limits; the rated capacity, or a variable rated capacity, must be displayed in the operator's cabin [S5]. WorkSafe Victoria adds that the lifting point must include a fully enclosed eye with a rated capacity matched to the excavator, and the example standard cited for lifting eyes is AS 13031 [S5].
Where ISO 10567 governs the actual measurement of the lift chart, the procedure defines the three machine positions, the 1 m grid, and the three-point repeat test, which is why a chart labeled to ISO 10567 is the cross-vendor reference that buyers should require when comparing two machines of similar operating weight [S3].
Limitations and Common Failure Modes
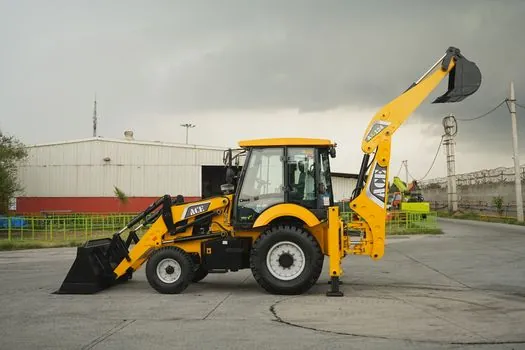
Soft or uneven ground reduces effective stability well before the hydraulic limit, because the reaction at the tracks shifts and the tipping line moves inward, so the published chart's static values become non-conservative in real conditions [S2]. A suspended load that swings into the cab is a documented failure mode, and WorkSafe Victoria lists struck-by loads, hydraulic failure from overloading, and overturning as the headline hazards that the lift chart is meant to prevent [S5].
Side-swing while lifting, common on urban jobsites, drops the rated value below the over-blade figure, and a 1.5-ton class machine that rates 750 kg over the blade down can drop below 400 kg at full reach over the side, which is well below the operator's intuition of "about half a ton" [S2][S3]. For plant managers the practical guardrail is to ban personnel under any suspended load, require the cab-side chart to be legible and current, and to verify the chart configuration against the actual installed counterweight before each shift [S5].
Buyers who want a broader spec on the machines themselves can review the excavator operating envelope and class breakdowns, and the safety and rigging side of the question is covered in the lifting-vehicle design reference. For plant owners comparing compact machines against telehandlers and small cranes on the same lift task, the industrial valve sizing and pressure-rating methodology is a useful parallel on how published charts drive real-world limits. A useful cross-cut on how attachments and quick couplers eat into a published chart is laid out in our equal-wheel vs unequal-wheel backhoe loader selection spec map, and for the broader procurement question of how cab charts compare to vendor brochures, the PLC scan time vs task cycle time reference is a useful parallel on how published and measured specs diverge.