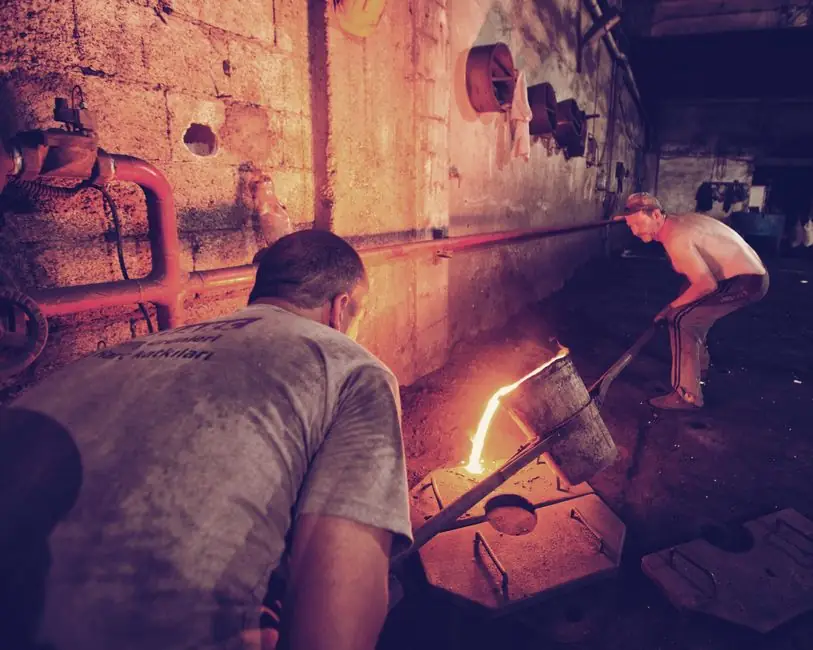
Global ferrosilicon demand is sized at USD 12.12 billion in 2026 and is projected to reach USD 16.93 billion by the end of 2036 at a 3.4% CAGR, with deoxidizer applications accounting for more than 70% of 2025 volume and Asia-Pacific holding 64% of regional share by 2036 [S5][S3].
China alone accounts for 23% of the global ferrosilicon market in 2026, supported by its dominant position in steel production and ferroalloy manufacturing, while Chinese exports of ferrosilicon reached USD 1.34 billion in 2022 with a 37.6% export CAGR [S2][S5].
Manufacturer Tiering: Who Actually Makes the Volume
The supplier base breaks into three operating tiers defined by submerged-arc furnace capacity, captive power, and silicon-grade purity, with the top tier concentrated in Inner Mongolia, Yunnan, and the Russian Urals [S6].
Tier 1 producers run captive hydroelectric or coal-bed methane assets that lock in electricity below grid parity, which is the single largest cost line in submerged-arc ferrosilicon smelting.
Tier 2 producers are mid-sized Norwegian, Indian, and Brazilian operators that focus on 75% FeSi and FeSiMg grades for ductile iron foundries, while Tier 3 is a fragmented long tail of merchant smelters serving regional cast-iron shops [S6][S4]. The named players appearing across the published league tables include American Elements, Assmang Limited, China National BlueStar (Group) Co. Ltd., Cometal S.A., and DMS Powders [S4].
Regional Share: Asia-Pacific 64-67%, China 23% Standalone
Asia-Pacific is the largest regional ferrosilicon market at 64% share by 2036, with the same region described as the fastest-growing in alternative forecasts and reaching 67% of global share in 2025 [S5][S4][S3].
China's standalone national share is 23% in 2026, a number that sits below the regional Asia-Pacific aggregate because the regional pool also includes India, Japan, South Korea, Malaysia, and Vietnam [S2]. North America is forecast to expand at a 2.21% CAGR over the 2025-2035 horizon, reflecting the smaller absolute base of U.S. silicon production that ran 22,100 metric tons gross in September 2024 against 21,900 t in August 2024 [S3][S5].
Application Mix: 70% Deoxidizer, 45% Carbon and Alloy Steel
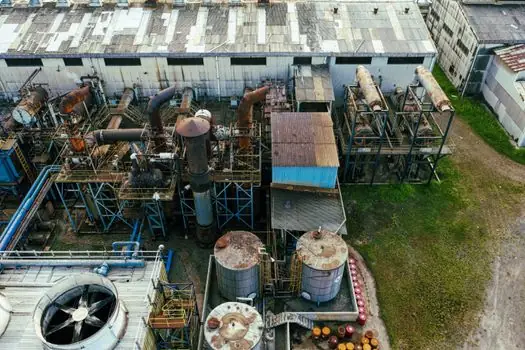
By application, deoxidizers capture more than 70% of ferrosilicon consumption in 2025, while the inoculants segment is projected to grow at the fastest rate through 2035, driven by ductile iron demand [S3].
By end use, carbon and other alloy steel accounts for more than 45% of share in 2025, with cast iron forecast to post significant growth on the back of wind-turbine hubs, automotive casting reshoring, and municipal infrastructure pipe demand [S3].
Supply Constraints: Power, Quartz, and Electrode Costs
The binding constraints for new ferrosilicon capacity are not iron or quartz, both of which are widely available, but rather baseload electricity, graphite electrode availability, and low-ash reducing coal, all of which tie output to industrial power-purchase agreements [S6].
U.S. ferrosilicon imports reached 6,040 t in September 2024, while overall silicon metal imports spiked 47% from August 2024 to 13,500 t in September 2024, roughly double the September 2023 level, evidence that domestic supply remains structurally short of consumption [S5]. The USGS table for 2024 also shows producers' ending stocks at 20,600 t in September 2024 against 17,500 t in January 2024, a working inventory build that signals softening spot demand rather than capacity expansion [S5].
Adjacent mineral exposure is also rising: a 2024 USGS file report notes that China dominates the gallium and germanium global supply chain, and that a full restriction on imports from China could shave USD 3.1 billion (0.013%) off U.S. GDP, with 46.5% of the hit concentrated in semiconductor and connected-device manufacturing [S5].
Selection Criteria: Grade, Particle Size, Power Footprint
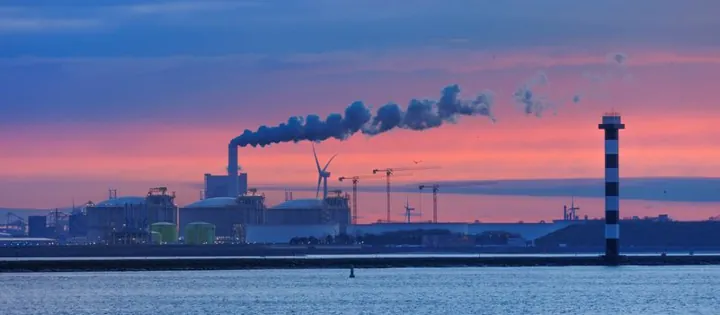
Buyers picking a supplier for foundry-grade 75% FeSi should rank candidates on three engineering criteria: silicon tolerance (typically +/-1% of nominal grade), aluminium and calcium tramp limits (both capped below 1.5% for clean steel deoxidation), and documented furnace power consumption per tonne of tapped metal [S6].
For magnesium-ferrosilicon inoculants used in ductile iron, the comparable ranking shifts to particle-size distribution (the common 0.2-0.7 mm and 1-3 mm fractions for in-stream and in-mould addition respectively), rare-earth content, and bag-house fines recovery rate [S4][S6]. Specialty chemical majors in adjacent markets also dominate trading desks: see the specialty chemicals market share ranking for 2025 for context on how vertically integrated chemical suppliers position against merchant producers.
Selection shortcuts for procurement: confirm ISO 9001 quality system registration, request a mill test certificate aligned with ISO 5445 or equivalent national standard, and verify the producer's captive-power share because a swing of 0.5 GWh per tonne at industrial tariffs shifts FeSi 75 cost by roughly USD 35-50 per tonne [S6].
Adjacent Process Sides: Where Ferrosilicon Touches the Plant
Ferrosilicon is consumed in the same plants that buy pressure transmitters for ladle degassing instrumentation and flow meters for argon shrouding lines, which is why the supply chain risks tend to correlate with broader ferroalloy and steel-cycle indicators [S5].
Inside a steel mill, FeSi addition is metered by industrial valve-controlled hoppers and weighed through load cells tied to the PLC batch recipe, and the pneumatic conveying lines upstream are typically protected by pressure sensor-driven filter monitors, all of which means ferrosilicon specification changes cascade into control-loop tuning [S6][S3]. On the cast iron side, the inoculation wire feeders run on servo motor-driven pinch rolls, where particle-size consistency directly affects feed-rate accuracy and magnesium recovery.
Forecast Reading: 2.5%-3.4% CAGR Across Houses
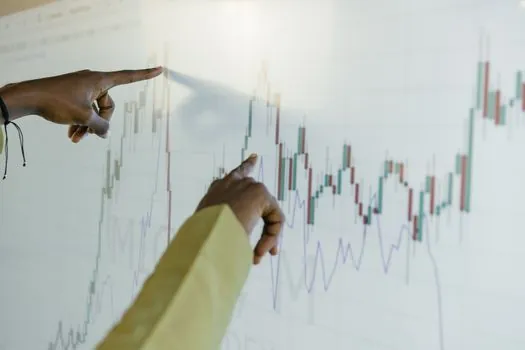
Published 2026 ferrosilicon CAGR estimates span 2.5% (Grand View, Maximize Market Research, Precedence) to 2.7% (CMI), 3.3% (P&S Intelligence), and 3.4% (Research Nester), with the 2026 base year sized between USD 12.08 billion and USD 12.52 billion across the same publishers [S1][S3][S4][S5][S7][S8].
The 2.5% CAGR cluster aligns with mature-market steel saturation and deoxidizer volume flatness, while the 3.3-3.4% cluster assumes faster inoculant and electrical-steel pull-through, particularly for grain-oriented silicon steel used in distribution transformer cores [S3][S5]. For silicon and ferrosilicon buying teams, the next data node is the USGS monthly silicon statistics release for Q4 2026 (expected October 2026), which carries the September 2024 import and stocks baseline already in the table above [S5].