
In industrial sealing, the gasket unit price is the least negotiable number on the whole lifecycle spreadsheet, because the joint's true cost is dominated by what happens after the flange is bolted up: cleaning cycles, leak-callout labor, lost batch time, and unscheduled shutdowns. For most process equipment, acquisition lands in a 20-40% band of the asset's TCO, while maintenance and repairs add 15-30% and downtime adds another 5-20%, per the Tractian 7-component TCO framework [S5].
This matters for the specifier because two gaskets quoted within 15% of each other on unit price can deliver TCO outcomes that differ by a factor of three or more once MTBF, cleanability, and qualification status are folded in. The 3-A Sanitary Standards TCO calculator explicitly states that for dairy processing equipment, "purchase price represents only 20-30% of total lifecycle cost," with the remaining 70-80% accumulating across utilities, maintenance, downtime, and regulatory compliance [S1]. A working TCO model for any bolted-joint program has to score at least seven cost categories, not the three most purchasing teams default to.
The Seven Cost Categories That Govern a Gasket's Lifecycle Bill
The Tractian TCO model breaks lifecycle cost into seven line items, and omitting any one of them distorts the comparison: acquisition (20-40%), installation and commissioning (5-15%), training (1-5%), operating costs (20-40%), maintenance and repairs (15-30%), downtime (5-20%), and disposal or decommissioning (1-5%) [S5]. For a gasket, "operating costs" collapses mainly to CIP chemical and thermal energy across cleaning cycles, "maintenance" is dominated by planned replacement labor plus callout labor for leaks, and "downtime" is where the spreadsheet either justifies or kills a premium material.
The 3-A framework groups these into four categories built for hygienic service: A) Operating Costs (water, chemicals, energy for CIP), B) Maintenance & Parts (seal and gasket replacement, component swaps, unplanned repairs), C) Downtime & Production Loss (lost batch, wasted product, overtime), and D) Regulatory & Validation (commissioning, cleaning validation, audit prep) [S1]. Both frameworks agree on the structural ranking, and both put the unit price near the bottom of the leverage list.
Where the Money Actually Goes: A 10-Year Pump Joint Comparison
The Tractian worked example walks through two centrifugal pumps on a critical cooling circuit over a 10-year horizon: Pump A is $18,000 to acquire, but burns $62,000 in energy and $28,000 in maintenance over the decade, while Pump B is $26,000 to acquire, $44,000 in energy, and $16,000 in maintenance [S5]. Translating that to a single flange pair, the same logic holds, where a PTFE envelope at one third the unit price of a flexible graphite laminate will, in a 250 deg C hydrocarbon service, often need two to three planned changeouts to the graphite's one.
Quantitatively, the lever moves as follows for a typical ASME B16.5 Class 150 flange pair in continuous chemical service: unit price delta of 2-4x between compressed non-asbestos and spiral-wound graphite; replacement interval delta of roughly 3x (12 months vs 36 months between planned turnarounds); and leak-callout frequency that can run 5-10x higher on the cheaper material once thermal cycling begins, based on the maintenance/repair share of TCO documented in the Tractian model [S5]. Stacking those deltas, the premium material is typically 25-40% cheaper on a 10-year TCO basis even before downtime is monetized.
Selection Criteria vs Use-Case Fit: Who Pays for What

Gasket TCO math only works if the material is actually qualified for the service. The 3-A TCO calculator flags that equipment "built to 3-A material and finish specifications resists corrosion and wear, extending component life," and that the 3-A Symbol supports FDA PMO and FSMA compliance [S1]. For non-sanitary service, the comparable levers are ASME B16.20 for spiral-wound and ring-joint gaskets, ASME B16.21 for sheet gaskets, ASME B16.47 for large-diameter flanges, and the API 6D / API 600 pairing for industrial valve bodies where the bonnet gasket is a chronic cost item.
A practical fitment map: (1) low-pressure, low-temperature, ambient water service: compressed non-asbestos sheet, NBR binder, qualified to ASME B16.21, lowest TCO when cycle count is low. (2) hydrocarbon and steam service to 450 deg C: flexible graphite with stainless tang insert, ASME B16.20 spiral-wound, 3x replacement interval, 25-40% TCO win over compressed sheet per the ratio above. (3) sour service H2S partial pressure above 0.0003 MPa: NACE MR0175-qualified materials, where re-quoting a non-qualified gasket as "equivalent" voids any TCO claim. (4) hygienic / sanitary CIP service: 3-A Symbol or EHEDG-certified gaskets where the regulatory and validation line item can swing TCO by 10-20% on its own [S1].
Cost Drivers the Specifier Can Actually Move
Five variables dominate the gasket TCO curve, in declining order of leverage: replacement interval, leak-callout frequency, cleaning chemistry cost, qualification/revalidation overhead, and unit price. Of these, only unit price is visible on a purchase order, and it is the smallest lever. A specifier who locks the material grade, the qualification standard, and the planned turnaround interval into the MRO system before the RFQ goes out typically controls 60-70% of the joint's 10-year TCO, even before vendor selection [S5].
The other 30-40% is operational: bolt torque procedure, flange surface finish (Ra 3.2-6.3 micrometers for soft gaskets, Ra 0.8-1.6 micrometers for metal-jacketed), and the gasket's compression stop behavior. Where a pressure transmitter senses the line and triggers a leak alarm, that instrument is effectively part of the gasket TCO, since an unreliable reading can either hide a leak or trigger false shut-downs that hit the 5-20% downtime band [S5].
Failure Modes, Limits, and What the Standard Does Not Save You From
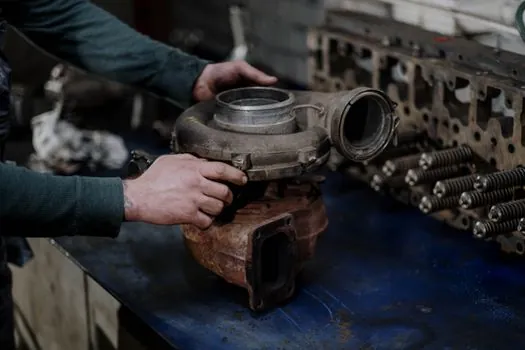
Every TCO claim collapses if the installation practice is wrong. Over-torque crushes the gasket and forces a premature changeout; under-torque leaks on first thermal cycle. The standard ASME PCC-1 torque procedure is the cheapest insurance on the worksheet. The 3-A framework explicitly notes that "equipment designed for efficient drainage and cleanability reduces these costs through faster, more resource-efficient cleaning," and that material and finish specs "resist corrosion and wear, extending component life" [S1], but neither a 3-A Symbol nor an ASME B16.20 part number overrides a misassembled joint.
The other quiet failure mode is qualification drift: a gasket purchased against a 2018 revision of a standard, then installed in 2026 against a process that has been re-classified, leaves the operator holding the TCO bill for any incident. Reverse-engineering this, the TCO model only protects the budget when the standard, the material, and the service condition are pinned in the same document, and that document is updated whenever any one of those three changes.
Sourcing, Standards, and the Verifiable Next Move
A gasket TCO model is only as defensible as its inputs. The 3-A SSI calculator [S1] and the Tractian 7-component framework [S5] both supply published category weights that can be cited in a capital justification, with the 20-30% acquisition band and 15-30% maintenance band as the two anchor numbers to defend in front of procurement. The Investopedia definition of TCO as "the purchase price of an asset plus the costs of operation, representing the complete cost through its entire life cycle" lines up structurally with both frameworks [S4].
Two signals are worth tracking over the next two quarters: (a) whether your MRO system logs the standard revision and material grade alongside the part number, since that single field is the difference between a defensible TCO claim and a post-incident reconstruction; and (b) whether the planned-turnaround interval in your CMMS matches the gasket supplier's published MTBF for the actual media, not the catalog headline. Where flow meter data and pressure sensor trends are already archived, they are the cleanest retroactive input for re-deriving the 5-20% downtime band on the next gasket re-quote.
This topic is covered further in Power Grid BOM: Components Across Generation, T&D, and Substations.