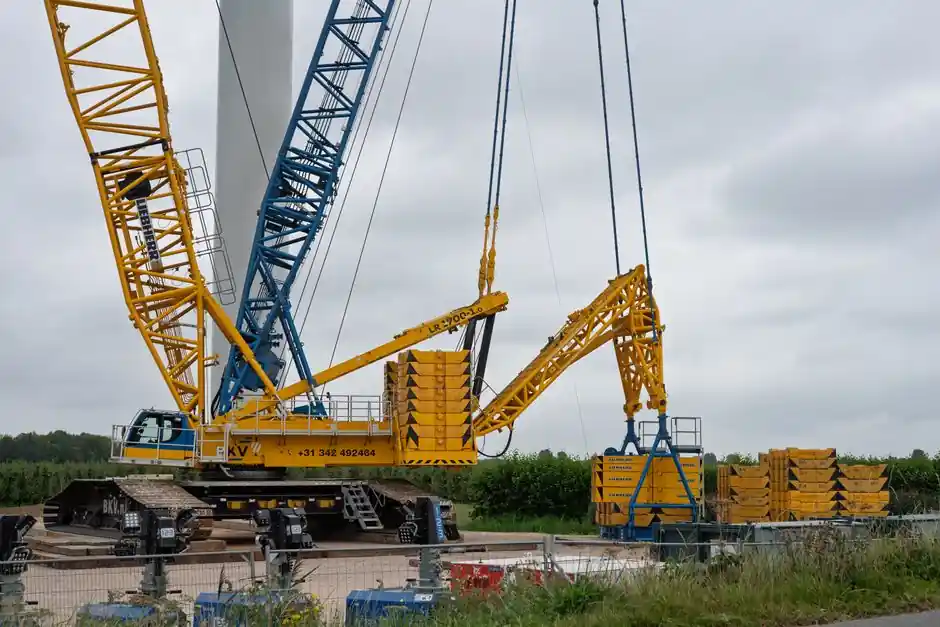
A truck crane does not have a single fixed lifting capacity; the rated value on the load chart is a function of boom length, working radius, outrigger setup, and slewing sector, and operating outside any of those conditions is treated as an unsafe lift regardless of operator experience [S2].
The chart is built around a load moment relationship, where overturning moment equals load weight times horizontal radius from the slewing axis, so a 10,000 lb load at 20 ft produces 200,000 ft-lb while the identical load at 40 ft produces 400,000 ft-lb, even though nothing about the load itself changed [S3][S5]. For a truck-mounted crane this is the variable that most often determines whether a planned pick is in or out of chart.
Three Variables That Drive Every Chart Entry
A load chart is specific to one crane model and one configuration, and operators must use the correct chart for the actual machine, because two visually similar units can carry very different capacity matrices [S3][S5]. The chart is built from three primary variables that must be identified before any capacity value is trusted.
Working radius is the horizontal distance from the crane's center of rotation to the vertical centerline of the hook, not the diagonal length of the boom and not the distance from the truck bumper [S1][S4]. Boom length is the extended length of the telescoping sections from the boom foot pin to the head, and on typical UNIC-style knuckle boom units it steps through discrete lengths such as 3.17 m, 5.10 m, 7.00 m, and 8.90 m as additional sections deploy [S1]. Rated capacity is the maximum total suspended load at the chart intersection, and it includes the weight of the hook block and any lifting accessories, not just the net payload [S1][S4].
Why the Same Load Becomes a Different Lift at a New Radius
Radius is the single most influential variable on rated capacity, because the further a load sits from the slewing axis the greater the overturning moment the boom and chassis must resist [S1][S3]. With boom length and counterweight fixed, capacity at a longer radius can drop to a small fraction of the maximum figure quoted close to the column.
The published maximum capacity almost always applies at the shortest working radius with the load positioned close to the center of the column, and a crane rated 3,000 kg at 2 m may only lift a fraction of that at 8 m on full boom extension [S4]. When the planned radius falls between two values printed on the chart, the conservative practice is to use the lower of the two adjacent capacity figures, which builds in margin against interpolation error and against real-world variations in ground level, sling length, and load swing [S4].
Outrigger Setup, Counterweight, and Slewing Sector
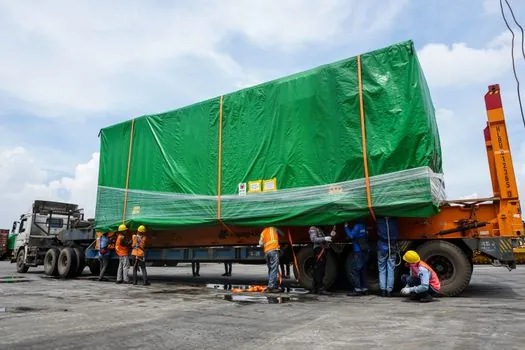
Outrigger configuration is treated as a separate chart in most manufacturer documentation, and the same crane on fully extended outriggers will show a higher capacity matrix than the same crane on retracted or intermediate outrigger positions [S2][S5]. A truck crane with no outriggers deployed is effectively in a different machine class, and the load chart for that condition must be used rather than a remembered figure from a fully outrigged lift.
Counterweight, jib or extension configuration, parts of line, and the lifting quadrant (full 360 degree versus limited rear or side sectors) are each listed as separate conditions on the chart, and capacity is only valid when all of those variables match the actual setup on site [S3][S5]. For slewing, many mobile crane charts split capacity by zone, with stronger ratings over the rear axles where the chassis structure is stiffest and lower ratings over the sides or front where the tipping line is shorter.
Reading the Chart Step by Step on a Real Pick
The standard reading sequence is: confirm the correct chart for the exact crane model, identify the actual boom length and number of sections extended, measure or calculate the working radius to the hook centerline, select the outrigger configuration in use, and then read the capacity at the intersection of those rows and columns [S1][S2][S6]. The published value at that cell is the maximum gross suspended load, so the planned load weight plus hook block plus all rigging and slings must be subtracted from that number to confirm the lift is in chart.
A worked example from a UNIC-style load chart illustrates the geometry change: with a 5.10 m two-section boom at a 3 m radius the rated capacity is several times higher than at 7 m on the same boom, and switching to the 8.90 m four-section boom at 7 m drops capacity again because the longer lever arm multiplies the moment acting on the structure [S1]. The numeric values in any real chart vary by manufacturer, but the pattern of steep capacity loss as both radius and boom length grow is consistent across mobile crane classes [S2][S3][S4].
Common Interpretation Mistakes That Cause Over-Rated Picks
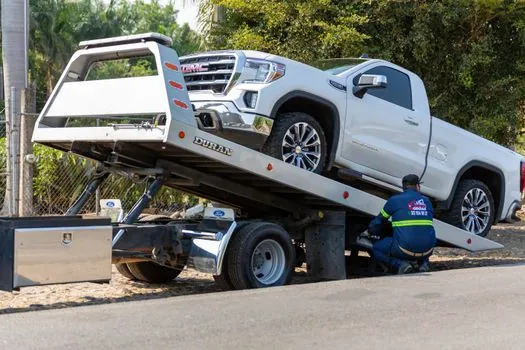
The most frequent error is treating the headline maximum capacity as a constant rating, when in practice that figure only applies at the minimum radius and minimum boom length on the strongest outrigger setting [S2][S4]. A close second is reading the boom length as the radius, which understates the horizontal lever and silently pushes the pick outside the chart.
Other common errors include using a chart from a similar but different crane model, forgetting to subtract hook and rigging weight from the chart value, ignoring the outrigger position actually in use, and failing to recheck the chart whenever the lift geometry changes mid-project [S2][S3][S5]. On confined urban and infrastructure sites, slewing sector restrictions often reduce the available capacity further, and the chart for the limited-angle zone must be used rather than the 360 degree full-rotation rating [S2].
How This Connects to Adjacent Lifting Decisions
Load chart reading is one of several configuration-driven decisions on a lifting job, and the same radius-versus-capacity logic drives specification choices on other equipment classes such as lifting vehicles and reach trucks, where the published rating only holds at the load center indicated on the data plate. Operators planning a critical lift will typically pair the chart check with a verified load weight, a measured radius, and a documented outrigger setting before any pick is authorized [S3][S5].
For broader lift planning context, the principles of matching machine class to lift geometry carry across to tower crane selection by site constraints and to stacker crane payload decisions, where capacity at a specific working point is always the operative figure rather than the headline maximum.
Limitations of the Chart and What It Does Not Cover

The chart is a static, level-ground, ideal-condition document and it does not account for soft ground that allows outrigger sink, for wind on the load or boom, for dynamic forces from swinging or sudden stops, or for side loads that introduce horizontal moment the chart does not model [S2][S3]. Operators must apply additional deductions and derates on top of the chart value for any of those conditions, and the final margin is usually held above the regulatory minimum.
The chart also assumes all attachments are OEM-approved and correctly installed, and it is invalidated the moment a non-standard hook, block, or jib is fitted without a revised chart entry from the manufacturer [S3][S5]. For a load cell instrumented lift, the measured line load provides a real-time check against the chart figure, but the chart itself remains the legal capacity limit, and the load cell cannot authorise a pick that is already out of chart.