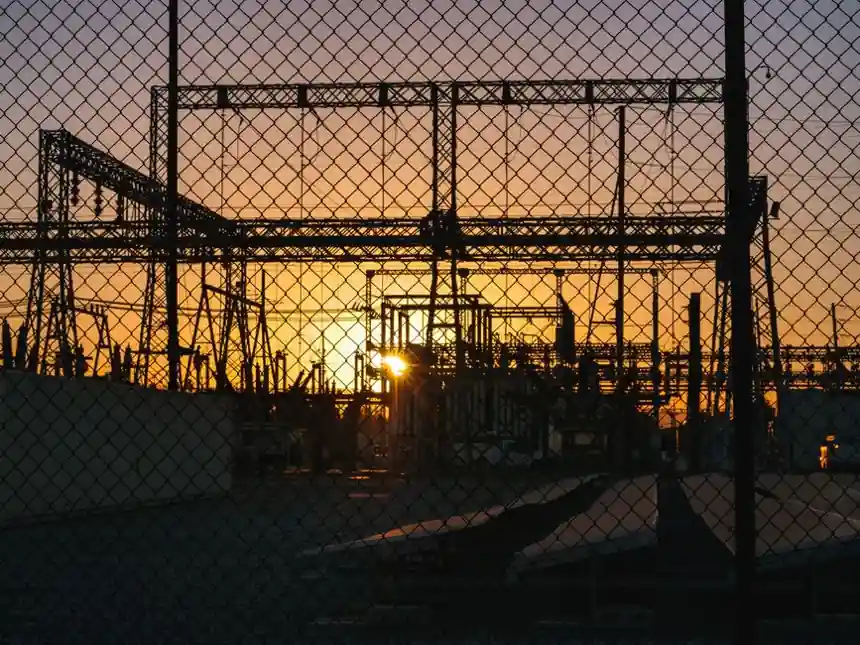
Industrial loads supplied the largest share of demand response (DR) across all sectors in 2026, with around 75 GW of utilisation recorded in IEA's Electricity 2026 flexibility tracking [S3]. That capacity now anchors how system operators balance variable renewable generation, and it defines where process engineers, plant managers, and energy procurement teams should focus their 2026-2027 strategy.
The commercial frame is equally large: the global DR market is estimated at USD 39.5 billion in 2026, up from USD 35.2 billion in 2025, and is forecast to reach USD 124.9 billion by 2036 at a 12.2% CAGR [S5]. Services lead the solution mix at 32.0% share, with commercial buildings at 27.8% of end use and automated demand response (ADR) at 35.0% of technology share [S5]. Compensated curtailment for commercial and industrial (C&I) participants commonly clears at $50-200/MWh for peak load reduction in 2026 programs [S4].
What counts as industrial demand response, and who actually participates
Industrial demand response covers voluntary, dispatchable load reduction or load shift from manufacturing, process, and large facility customers, typically those with peak demand above 350 kW per the LBNL scoping framework [S2]. Participation generally divides into price-based programs (real-time pricing, critical peak pricing, time-of-use) and incentive/ancillary programs (capacity payments, emergency curtailment, ancillary services bids, and aggregator-managed portfolios) [S2].
Plant-side participation is still skewed toward process-heavy sites with thermal or electrochemical flexibility: aluminium smelters (potline curtailment), electric arc furnaces, chlor-alkali lines, pulp and paper mills, air-separation units, cement kilns with kiln-stopping tolerance, and HVAC-dominated data halls [S3]. Newer entrants include data-centre cooling loops and electrolyser hydrogen lines, both of which qualify for the "flexible large loads" category that the FERC aggregator rulemaking targets [S1]. The IEA's 75 GW industrial figure is drawn from explicit program enrolment plus the curailable portion of large-industry baseload, so the true dispatchable envelope sits above that headline.
Aggregator rule changes: FERC Order 2222 and the May 2026 effective date
The Notice of Proposed Rulemaking on "Participation of Aggregators of Retail Demand Response Customers in Markets Operated by Regional Transmission Organizations and Independent System Operators" was published 21 April 2026, with withdrawal of the proposal to become effective 21 May 2026 [S1]. Operationally this means FERC has walked back the proposed expansion of retail-customer aggregation rules in RTO/ISO markets, leaving the prior framework built on FERC Order 719 (2011) as the standing reference for aggregator participation [S7].
For plant managers, the practical effect is a two-track landscape: in RTO/ISO footprints (PJM, MISO, CAISO, NYISO, ISO-NE, SPP, ERCOT for its own market), aggregators register portfolios of retail end-use customers and bid the aggregated capacity into wholesale markets; outside those footprints, retail utility tariffs and state-level programs govern enrolment [S1]. The withdrawn proposal would have further reduced the minimum asset size for participation, so 2026 program design remains the existing 100 kW minimum threshold common to most RTO capacity markets rather than a smaller retail-class threshold [S1].
Compensation economics: $50-200/MWh curtailment, capacity, and ancillary stacking
Compensated curtailment for C&I participants in 2026 programs commonly settles at $50-200/MWh for peak load reduction events, with payment terms defined per dispatched MWh of verified curtailment [S4]. Industrial sites typically stack three revenue streams: an energy payment ($/MWh curtailed), a capacity payment ($/kW-month for committed dispatchable capacity), and ancillary services revenue (regulation, spinning, non-spinning reserves) where the site can respond within the ancillary service's response time and ramp rate.
Stacking matters because pure energy payments rarely justify retrofits. A 10 MW electrolyser or 5 MW arc-furnace site that earns a $15/kW-month capacity payment plus $80/MWh on dispatched energy can clear economic thresholds that energy-only payments cannot reach. The $50-200/MWh range maps roughly onto wholesale capacity scarcity pricing during 2026 summer peaks, with the upper end triggered during tight reserve margins and the lower end during shoulder-peak events [S4]. Sites that can curtail within the regulation-up response window (typically 4-second area control error tracking) capture the highest per-MWh value but require automated control loops.
Technology options: manual curtailment, ADR, and AI-enabled aggregation
Industrial DR in 2026 spans three control architectures. Manual curtailment relies on operator-driven shutdown or throttling during a dispatch signal, common in older chemical and metals plants where automation is limited. Automated demand response (ADR) uses a facility energy management system (FEMS) or industrial control system to receive an OpenADR 2.0b signal and execute a pre-registered load-shed sequence without operator action; ADR is the leading technology segment at 35.0% of 2026 market share [S5]. AI-enabled aggregation layers forecasting, baseline modelling, and dispatch optimisation on top of ADR, allowing the aggregator to commit larger portfolios at tighter performance bands.
Selection depends on four criteria: (1) curtailment duration tolerance, (2) response time required (4-second regulation vs 10-minute spinning vs 30-minute non-spinning), (3) cost of shed ($/MWh of foregone production), and (4) site automation depth. A cement kiln with 2-4 hours of stopping tolerance and a SCADA-connected preheater fan array is a strong ADR candidate; a continuous catalytic reformer with no safe ramp-down path is generally not. Process engineers should baseline each major load centre against these four criteria before committing capacity to an aggregator.
Limits and obstacles: why industrial DR still underperforms its potential

Industrial demand response has been called "promising potential" for over a decade, and uptake remains a fraction of the technical envelope [S6]. The literature catalogues persistent obstacles: process constraints that cap safe curtailment depth, revenue uncertainty from event-based dispatch, baseline calculation disputes between the customer and the system operator, metering and telemetry gaps at older sites, and the internal accounting problem where the energy bill savings accrue to procurement while the production hit accrues to operations [S6].
Quantitatively the 75 GW of industrial DR is large in aggregate, but per-site it remains a small slice of nameplate. The Leinauer (2022) review of 107 citing works finds that industrial uptake is concentrated in the aluminium, steel, and chlor-alkali subsectors where the load has inherently flexible thermal or electrochemical storage; sectors such as food processing, pharmaceuticals, and continuous petrochemicals contribute much less because their process windows cannot absorb 1-4 hour curtailments without product loss [S6]. For sites in those rigid sectors, the realistic 2026 options are limited to HVAC, chilled-water, compressed-air, and lighting loads, which cap participation at a few hundred kW per facility.
Standards, codes, and the regulatory backbone
No single international standard governs industrial DR, but several are operationally binding. OpenADR 2.0b (OASIS Energy Interoperation) is the de facto signal protocol between utilities/aggregators and the FEMS, and IEC 62746-10-1 (originally IEEE 2030.5 mapping) defines the customer-side interface. Wholesale-market participation falls under each ISO's tariff: PJM's Manual 11 and Manual 18, MISO's Module E, CAISO's BPM for Demand Response. In the US, FERC Order 719 (2011) set the original aggregator participation rules, and FERC Order 2222 (2020) extended them to distributed energy resource aggregations, with state-by-state implementation still in progress [S7]. The April 2026 NOPR withdrawal does not invalidate Order 2222, but it removes the proposed retail-aggregation expansion that would have lowered the minimum asset size further [S1].
For EU sites, the ENTSO-E demand-side response network code and the relevant ACER framework documents apply, while individual member-state programs (e.g., Germany's abschaltbare Lasten, France's Call d'Offre Effacement, Italy's UVAM) set the technical and commercial envelope. UK sites fall under the National Grid ESO Balancing Mechanism and the Capacity Market (CM) rules. Industrial buyers running multi-country portfolios should map each site's program against its ISO's baseline methodology (e.g., 10-of-10 non-event days for PJM capacity, or the High 5 of 10 for CAISO) because baseline choice materially shifts revenue on any given event.
Selection matrix: which industrial sites fit which program
Four decision criteria separate the viable from the marginal: response time, curtailment depth, duration tolerance, and revenue stack. Electrolyser and data-centre cooling sites score well on all four and qualify for regulation, 10-minute spinning, and 30-minute non-spinning, with $50-200/MWh energy plus capacity stacking [S4]. Arc-furnace and aluminium potline sites score well on depth (single-event curtailment of 30-70% of feeder load is feasible) and duration (1-4 hours is realistic) but poorly on response time, so they are best matched to capacity and non-spinning rather than regulation. Continuous chemical processes fail on duration and depth, leaving only auxiliary systems (HVAC, compressed air, chilled water) which cap site participation in the low hundreds of kW. Cement, glass, and pulp/paper fall in the middle, with kiln-stopping or digester-brown-stock storage tolerance of 2-6 hours and ADR control depth that supports 10-20% feeder-load reduction.
The match between process type and program type drives most of the revenue variance observed across 2026 program disclosures [S4]. Sites that pre-qualify for multiple ancillary services capture the highest per-kW-year returns, while single-program participants generally recover only the capacity payment plus occasional energy payments, often insufficient to justify a dedicated FEMS retrofit at a small site. This is the economic case for aggregator participation: a 3-10 MW site that would not justify a standalone FEMS investment can still earn capacity revenue when bundled into an aggregator's portfolio under the Order 719 framework [S7].
Sourcing the program: utility, ISO, or third-party aggregator
Plant energy managers in 2026 generally source DR capacity through three channels: direct utility programs (often the simplest path for sites under 1 MW), ISO/RTO wholesale markets (required for the largest revenue stacks but with registration overhead measured in months), and third-party aggregators (CPower, Enel X, Voltus, Schneider Electric, Siemens, and similar platforms competing on automation and aggregation scale) [S5]. The aggregator route is the only practical option for sub-1 MW industrial sites in most US ISO footprints, and the FERC Order 2222 implementation timeline through 2026-2027 is gradually extending aggregator access to the smaller asset classes.
For data-centre-heavy portfolios, large flexible loads have their own fast-track participation rules, with some ISOs now offering "flexible large load" registration that exempts aggregated registration through an aggregator in favour of direct ISO participation [S1]. Plants evaluating direct participation should weigh the registration cost (legal, metering, telemetry) against the 1-3 percentage-point revenue uplift that direct market access typically captures over aggregator pass-through pricing.
The clearest trackable signal for the next 12 months is FERC's follow-on rulemaking on retail aggregator participation, since the April 2026 NOPR withdrawal leaves the underlying policy question unresolved and at least one further notice is plausible before the end of 2026 [S1]. A second signal is the IEA's next Electricity update, which will report whether the 75 GW industrial figure grows, holds, or compresses as renewable curtailment prices and capacity-market clearing prices move through 2027. For site-level decisions, a third useful signal is the capacity-market clearing price in the relevant ISO, since the $50-200/MWh energy payment range tracks those clearing prices across the cycle [S4].
Component reference pages worth checking: industrial adhesive, industrial borescope, and industrial buzzer.
For related coverage, see Rotary vs Line Laser Price Gap: 2026 Spec Decision.