
Lubricant procurement is not the biggest cost on a lubrication budget — TCO frameworks define total ownership cost as acquisition cost combined with recurring annual costs averaged over a 3-5 year lifecycle window, so the per-litre purchase price is only one component of total spend [S4].
This matters to plant engineers, reliability leads, and procurement specifiers who have to defend lubricant-grade switches against the lowest-bid drum price, and to PSS suppliers structuring service bundles around industrial lubricant portfolios rather than commodity resale [S3].
What TCO Actually Counts in a Lubricant Specification
Total Cost of Ownership is the sum of acquisition cost plus all operating cost across a defined time window, often averaged over 3-5 years to make alternatives comparable [S4]. For a lubricant, the operating cost stack includes: oil-top-up and change-out labour, filter and breathers, energy lost to boundary and mixed friction, unplanned downtime events, oil-analysis (OAP) sampling, and end-of-life disposal or re-refining fees [S3][S1]. The methodology literature explicitly couples these economic items with reliability block diagrams and Monte Carlo simulation so that condition-monitoring sensors can be sited where the TCO math justifies them — the same logic transfers to where oil-grade decisions get made [S1].
The Sogou TCO definition is operationally identical to the Ellram framework that dominates academic purchasing research: acquisition cost plus annual ownership cost, amortised over the asset's useful life [S4][S3]. For a 200 L drum of hydraulic oil used in a continuous-process press line, that pushes most spec writers away from $/L on the PO and toward $/operating-hour including energy delta.
Cost Drivers That Move the Price the Most
Four drivers swing lubricant TCO more than any spec-sheet tweak: base-oil chemistry, additive package, certification tier, and volume tier.
Additive packages — anti-wear (ZDDP), detergents, dispersants, rust inhibitors, foam suppressants — add $0.50-3.00/L to the drum but cut wear-particle generation, which directly reduces the unplanned-downtime line item that the predictive-maintenance TCO methodology models as the dominant risk-cost variable [S1]. Food-grade H1 lubricants with NSF registration and incidental-food-contact certification carry a 2-4x multiplier over industrial-grade equivalents; the premium is recovered only when audit risk and recall exposure are priced into the model.
Certification tier — ISO 6743-99 machine-tool categories, DIN 51517 hydraulic classifications, OEM approvals (Siemens Flender, Fluke-on-Cincinnati Milacron, Bosch Rexroth), and food/pharma registrations — gates which plants can use the product. Higher-tier approvals add direct cost and audit overhead but unlock multi-plant standardisation, which compresses SKU count and storage cost [S3].
Comparing Lubricant Categories Against TCO Criteria
Decision-grade comparison should be run on at least four axes: cost per operating hour, drain interval, energy-loss contribution, and disposal handling class. A plain mineral hydraulic oil at $3-5/L with 2,000 h drain sits next to a synthetic PAO at $10-18/L with 6,000-8,000 h drain — the synthetic looks expensive until labour, disposal volume, and energy are priced in, after which synthetic typically wins on plants running >4,000 h/yr per machine [S3].
Food-grade H1 synthetics (PAO or white-oil based) at $15-40/L recover the premium through NSF H1 registration, reduced HACCP friction, and the option to consolidate SKU lines across food zones. High-temperature chain oils (synthetic ester, PAG) at $20-60/L only pencil out on oven chains above 200°C where mineral alternatives coke and force weekly teardown cleans. Grease choices — lithium, lithium-complex, polyurea, calcium-sulphonate — are not interchangeable: polyurea greases last longer in electric-motor bearings but cost 2-3x lithium and require different relubrication intervals, which is itself a labour line on the TCO sheet [S3].
Who TCO Analysis Is For — and Where It Misleads
TCO modelling pays off in plants with continuous-duty assets, multi-shift operation, and OEM-warranty sensitivity — typically heavy industry, food processing, primary metals, and large HVAC-chiller fleets. A shop with 20 machines on single-shift operation and no oil-analysis programme will see the labour line dwarf the lubricant line in any honest TCO, and the right answer is usually to standardise SKU and reduce variety, not to chase the longest drain [S3][S1].
Where TCO misleads: undercounting the disposal / re-refining line, ignoring recall-class risk in food-grade applications, and over-weighting the energy delta in machines that are already running in the boundary-lubrication regime. Predictive-maintenance TCO work specifically flags the risk of over-investing in condition monitoring for low-criticality assets [S1]; the same logic applies to over-specifying a synthetic where a Group II mineral would deliver acceptable life.
Total Cost of Ownership Beyond the Drum Price
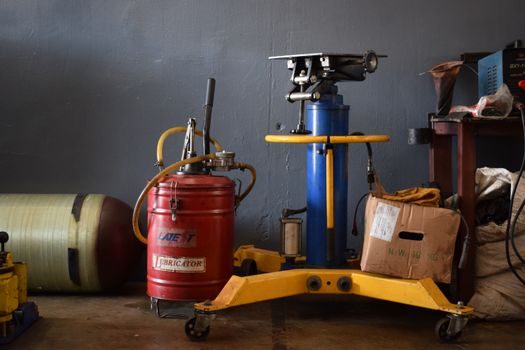
The often-skipped line items are waste-disposal class, used-oil pickup contracts, spill containment, and the labour burden of lube-route compliance. Used petroleum oil typically falls under regulated waste classes (EPA RCRA waste codes in the US, EU Waste Oil Directive 75/439/EEC for cross-border recovery) and disposal contracts run $0.50-2.00/L on top of the inbound price [S3].
The same logic informs the industrial camera and condition-monitoring decisions discussed in adjacent asset classes, where sensor capex is justified on TCO rather than per-unit cost.
Sourcing, Standards, and What to Verify on the PO
On the procurement side, TCO defensibility requires that the PO tie lubricant grade to a published spec, not a brand — ISO 6743-99 category, DIN 51517 part number, viscosity grade (ISO VG), and additive chemistry. NSF H1 registration number, OEM approval lists, and any food/pharma audit certificates should be cited on the datasheet. This is structurally identical to the TCO work the Springer PSS paper recommends for supplier selection: standardise the criteria, then run a cost-per-outcome comparison rather than cost-per-litre [S3].
For specifiers building multi-plant lubrication programs, the working artefacts are: a lubricant master schedule mapping machine → ISO VG → additive needs → drain interval; a used-oil disposal contract priced per litre; an oil-analysis programme (OAP) tied to wear-particle trend limits; and a TCO calculator that rolls acquisition, labour, energy, disposal, and downtime into a single $/operating-hour figure. Predictive-maintenance literature recommends the same systemic approach, using simulation to compare scenarios before committing spend [S1]. For a parallel TCO exercise on a completely different asset class, the slewing bearing TCO article walks through a 5-7 year framework on a similar four-axis logic, and a fire-rated door TCO article demonstrates the same method over a much longer 30-year horizon — both useful reference templates for an engineer building a lubricant TCO sheet from scratch.
Track these signals over the next planning cycle: OEM drain-interval guidance revisions for major machine families; re-refining capacity and used-oil pickup pricing in your region; and any NSF H1 / food-grade registration updates relevant to your production zones. Each one shifts the $/operating-hour number more than the per-litre drum price does.
The underlying component specifications are covered under total station.