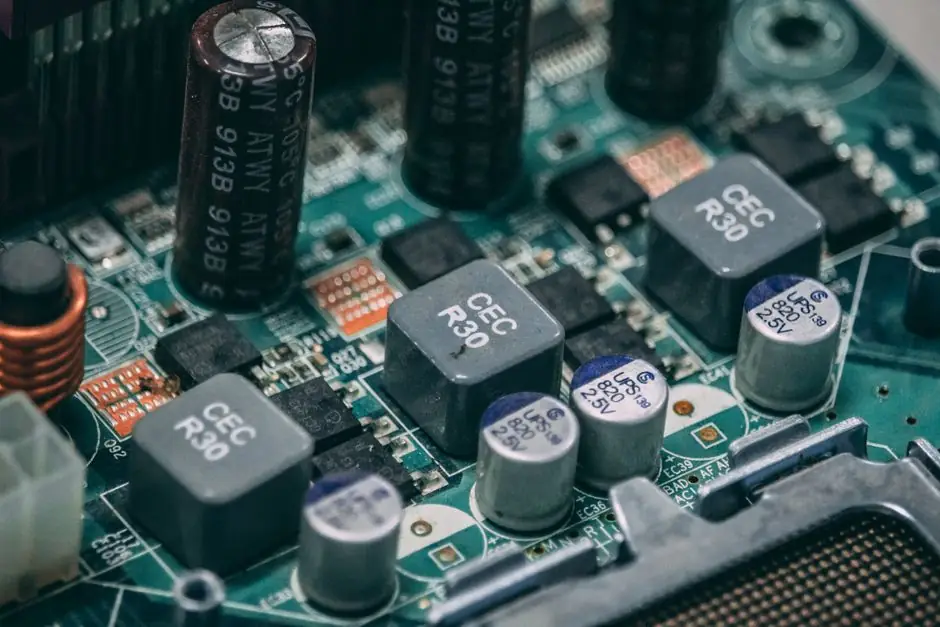
Semiconductor-cycle analysis in 2026 depends on 10 linked indicators, led by inventory days, DRAM, NAND and HBM pricing, and foundry utilization [S1].
Global semiconductor revenue is forecast to reach $1.29 trillion in 2026, up 52.8% from $842.8 billion in 2025, but AI infrastructure, memory and advanced logic are driving substantially stronger conditions than mature-node categories [S3].
Inventory Days and Inventory-to-Sales: The Primary Excess-Supply Test
Inventory days and inventory-to-sales ratios rank first for cycle analysis because rising inventory combined with slowing shipments identifies potential excess supply before revenue data fully reflects it [S1].
The data should be tracked across chipmakers, distributors, original equipment manufacturers and major customers rather than reduced to one company's balance sheet [S1]. A constructive signal occurs when revenue accelerates while inventory growth slows or total inventory declines [S1]. The warning signal is the reverse: inventory continues to rise while shipments or revenue growth decelerates [S1].
This indicator is especially useful for analog, automotive, industrial, PC and smartphone chips, where broad end-market demand matters more than the AI infrastructure cycle [S1]. Strategic stockpiling and supply-chain localization can distort the ratio temporarily, so a single reading should not be treated as a cycle call [S1].
DRAM, NAND and HBM Prices Must Be Tracked Separately
DRAM contract prices, NAND contract prices, the spread between spot and contract prices, HBM pricing, supply commitments and bit-supply growth provide distinct signals rather than one interchangeable memory metric [S1].
Memory pricing is ranked second because it responds quickly to supply-demand changes and has historically been one of the clearest cycle indicators [S1]. Conventional memory and AI-oriented HBM memory require separate treatment because they can move in opposite directions [S1].
IDC forecasts DRAM revenue of $418.6 billion in 2026, nearly triple the prior-year level, driven by HBM and DDR demand from hyperscalers and AI infrastructure providers [S3]. In the broader forecast, total memory revenue is $1.29 trillion minus $693.5 billion in non-memory semiconductor revenue, or $596.5 billion [S3]. That concentration makes memory pricing a strong read on AI infrastructure, but a weak standalone proxy for mature-node industrial demand [S1][S3].
Foundry Utilization and Wafer Demand Test the Supply Balance
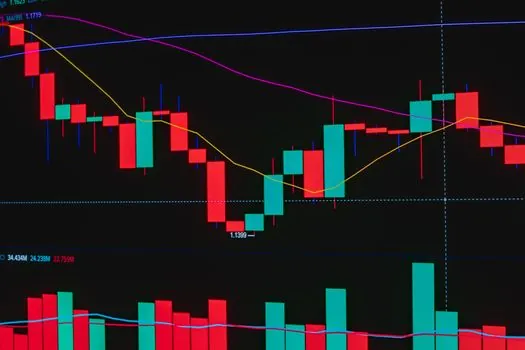
Foundry utilization and wafer demand form the third-ranked indicator and provide a coincident test of whether the industry is using the capacity being added [S1].
Three linked measures matter: foundry utilization rates, wafer starts and the demand visible in customer orders [S1]. Strong utilization validates the volume forecast, while falling utilization alongside rising fixed production costs exposes margin pressure before an inventory correction is fully visible [S1].
The 2026 market cannot be evaluated as one undifferentiated cycle. AI-related logic, memory, HBM and advanced manufacturing are leading expansion, while mature-node categories are growing more slowly [S1]. The 2026 semiconductor market is expanding, but growth is concentrated in AI-linked memory and advanced logic rather than spread evenly across the industry [S1].
Sales Momentum and Equipment Spending Provide Confirmation
Global semiconductor sales momentum is a lagging or coincident confirmation layer, while wafer fab equipment spending and equipment orders are forward-looking indicators of future capacity [S1].
These figures show why the dashboard needs both realized sales and planned capacity: sales establish demand, while equipment spending indicates how much supply suppliers intend to add [S1].
Equipment spending has a two-sided interpretation. It confirms customer demand when fabs invest in tools, but it also creates a future oversupply risk when capacity additions outrun end-market consumption [S1]. For industrial buyers, the relevant question is whether the equipment pipeline is concentrated in advanced logic, HBM and advanced packaging, where capacity remains constrained, or spreading into categories with slower demand [S1].
Lead Times, Distributor Inventory and Advanced Packaging Expose Turning Points
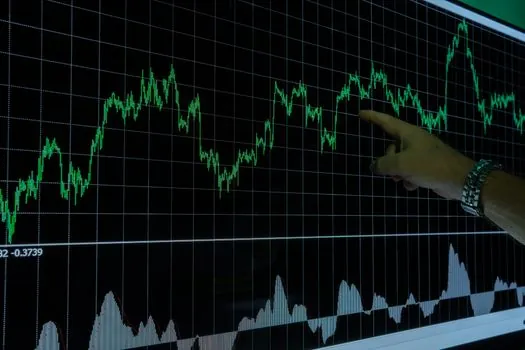
Lead times, order cancellations and distributor inventory are leading indicators of component shortages and demand reversals, while advanced packaging and HBM capacity identify the principal AI bottlenecks [S1].
Lead-time extension generally points to constrained supply, shortening lead times can signal improving availability, and rising cancellations alongside falling inventory expose weakening demand [S1]. Distributor inventory is distinct from manufacturer inventory: distributors can carry stock that has not reached end customers, making channel data a corrective to supplier-reported shipments [S1].
Advanced packaging and HBM capacity receive high importance for 2026 because advanced packaging connects accelerators, HBM stacks and high-speed networking into a working AI system [S1]. IDC forecasts total semiconductor revenue of $1.29 trillion in 2026, up 52.8% from $842.8 billion in 2025, with DRAM revenue projected to reach $418.6 billion and non-memory semiconductor revenue projected to reach $693.5 billion [S3]. Packaging throughput, substrate availability and HBM stack supply therefore deserve equal weight with wafer starts [S1].
Compare Leading Indicators by Decision Use
Inventory, pricing and foundry indicators answer different operational questions, and no single metric reliably identifies a semiconductor-cycle peak or bottom [S1].
Inventory days are best for detecting excess supply, memory contract prices are best for pricing cycles, foundry utilization tests the supply-demand balance, and equipment spending reveals future capacity [S1]. Global sales and gross margins confirm direction and profitability but are less useful for calling a turn [S1].
The practical rule is to seek confirmation across at least three independent signal families [S1]. For an AI-capacity thesis, that dashboard could combine HBM pricing, foundry utilization, advanced-packaging capacity and equipment spending. For an industrial-demand thesis, it should include inventory days, distributor stock, end-market orders and lead times rather than relying on AI-linked memory prices [S1].
For procurement and capacity planning, the same distinction applies. AI and memory indicators describe a fast, concentrated expansion, while conventional memory, mature-node logic and industrial components can follow a different cycle [S1]. IDC estimates non-memory semiconductor revenue at $693.5 billion for 2026, compared with total revenue of $1.29 trillion, confirming that AI does not represent the entire market [S3].
End Markets, Margins and Forecast Limits
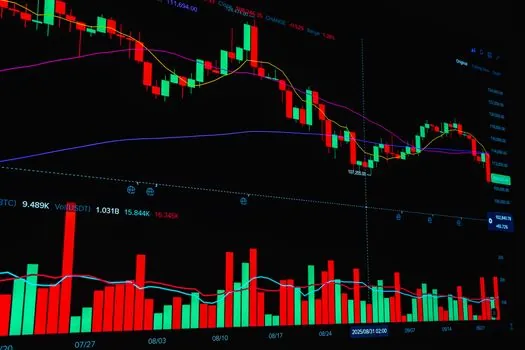
End-market demand is a leading indicator of durability, while ASPs, gross margins and pricing power provide coincident confirmation of the profit cycle [S1].
Hyperscale capital expenditure exceeded $100 billion for the first time in the third quarter of 2025, and the four largest hyperscalers are expected to increase capital expenditure by 70% year over year to approximately $600 billion in 2026 [S3]. IDC forecasts an intelligent data center segment of $281 billion in 2026, covering CPUs, AI accelerators, GPUs, custom ASICs and networking silicon [S3].
The limitation is concentration. AI infrastructure can support strong aggregate revenue while automotive, industrial and other mature-node categories remain comparatively slow [S1][S3]. Gross-margin direction adds confirmation, but it also reflects mix, utilization and pricing rather than demand alone [S1]. Forecasts such as $1.29 trillion in total revenue, $418.6 billion in DRAM revenue and $600 billion in hyperscaler capital expenditure are projections, not realized cycle outcomes [S3].
The next decision points are therefore measurable rather than rhetorical: monthly memory contract-price changes, inventory days, foundry utilization, fab-equipment orders, distributor inventory and lead-time revisions [S1]. A broad cycle call becomes defensible only when at least three of those independent families point in the same direction [S1].