
Global LNG enters a structural oversupply from 2027 as 2026-2030 liquefaction additions total roughly 202 million tonnes, equivalent to about 40% growth over 2025 and a compound annual rate near 6.8% [S2].
US projects supply 46.6% of the new volumes, Qatar 23.8%, Canada 7.6%, UAE 4.8%, and Argentina 3.0%, concentrating incremental cargoes into a US-Qatar duopoly that has implications for terminal scheduling, pressure transmitter calibration, and cryogenic flow-meter sourcing [S2].
2026 is the inflection year, peak loose is delayed to 2027-2028
New liquefaction capacity commissioned in 2026 reaches about 40.7 million tonnes per year, the first year since 2020 that systematic supply growth overtakes incremental demand [S2]. The 2026-2030 commissioning curve runs 40.7, 52.65, 53.24, 38.60, and 16.47 million tonnes respectively, with Golden Pass, LNG Canada, Costa Azul, and North Field expansions partially slipping into later years and pushing the loose-balance peak to 2027-2028 [S2]. Project deferrals and Russia-related sanctions mute what would otherwise be a deeper surplus, leaving a base-case 2030 gap of about 63 million tonnes between expected supply and the projected 560 million tonnes of total demand [S1].
Demand side: Asian growth, European share pinned at 43-44%
BloombergNEF models global LNG demand climbing to 560 million tonnes by 2030, with Asia driving most of the marginal volume as importers expand regasification to displace coal and oil in power, industry, and city gas [S1]. In Europe, LNG holds a 43-44% share of total gas supply across 2026-2030, meaning the marginal cargo still re-routes sharply on cold snaps, unplanned outages, or Asian pull, and Henry Hub-TTF spreads will remain the dominant pricing signal [S1]. That volatility profile sustains a long-term build-out case for floating storage, satellite LNG bunkering, and small-scale terminals, all of which rely on the same metering backbone as large-scale regasification: Coriolis flow-meter skids for custody transfer, ultrasonic meters for linepack, and redundant pressure transmitter chains on BOG compressors.
Supply geography: US-Qatar duopoly reshapes the trade map
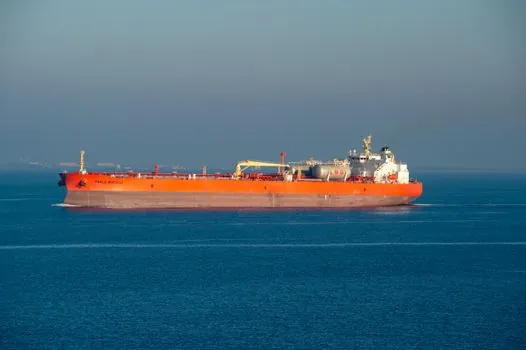
The 2020s LNG map was a multipolar spread; the 2026-2030 map converges on a US-Qatar core, with US projects alone adding roughly 94.2 million tonnes across the five-year window and Qatar adding about 48.1 million tonnes [S2]. Russia pipeline gas is sliding toward 40% of global supply as EU sanctions phase in, which raises LNG's pricing power at the global margin and pushes more buyers toward long-term SPAs indexed to Henry Hub rather than Brent or oil-parity slopes [S2]. For specifying engineers, the practical consequence is a wider Henry Hub-Brent decoupling, which feeds straight into fuel-gas valve sizing for LNG carrier boil-off and into regasification industrial valve trim material choices where hydrogen sulfide and CO2 specs vary by source field.
India and the second-tier importers: where the marginal cargo goes
India is positioned in long-horizon forecasts as a high-growth LNG importer, with research frameworks published in 2020 tracking demand through 2030 across RLNG terminals, city gas distribution, fertilizer, refinery, and transport-fuel (LNG for M&HCV and inland waterways) [S3]. India's growth path is structurally different from China or Europe: anchor CGD/PNG load, convertible demand from FO/HSD/LPG, and a build-out of LNG-as-transport-fuel hubs that require smaller-scale dispensing, LCNG stations, and hub-and-spoke logistics [S3]. For instrumentation, this translates into more small-bore Coriolis and turbine meters, more truck-loading custody skids, and a heavier reliance on pressure sensor redundancy at satellite storage tanks, rather than the large-tonnage regasification trains typical of the US Gulf and Qatar.
2026 incremental capacity by project and what it tests

The 2026 commissioning cohort, at about 40.7 million tonnes per year, is dominated by US Gulf trains plus the first wave of Qatar's North Field expansion, and it is the first cohort where pre-FID design assumptions (train size, BOG reliquefaction, electric-drive compression) are stress-tested under sustained low utilization [S2]. As trains run partial, operators will lean harder on condition monitoring: vibration on compressor bearings, multiphase flow-meter diagnostics on mixed-phase rundown, and pressure transmitter health checks tied to AMS-style predictive routines. When utilization drifts below design, BOG rates rise non-linearly, which tightens the tolerance band for custody-transfer measurement and makes the difference between ISO 5167 orifice uncertainty and Coriolis uncertainty financially material on a 15-25 year SPA.
Risks that keep prices swinging inside a structural surplus
Even with a base-case 63 million tonne oversupply by 2030, three risk vectors keep Asian spot prices reactive: unplanned outages, additional project slippage, and geopolitical shocks, including any further Russia-sanction escalation [S1]. The 43-44% European LNG share band means a single cold winter in North Asia plus an unplanned outage at a US Gulf train can re-spike JKM within weeks, even when the annual balance is loose [S1]. For buyers, this argues for portfolio diversification across Henry Hub-indexed US volumes, oil-indexed Middle East volumes, and Brent-slope Qatar volumes; for instrumentation and controls, it argues for designing regasification skids with wider turndown so a single industrial valve trim and flow-meter range covers both base-load and swing operation.
What to watch from here: FIDs, sanctions, and one Asian demand surprise
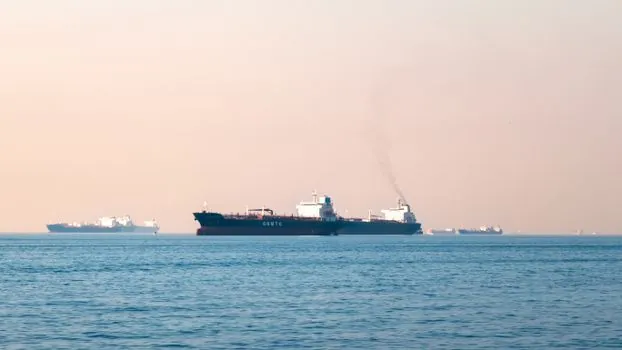
Two signals will recalibrate every 2026-2030 LNG model inside a quarter: the next wave of US LNG final investment decisions, where Plaquemines, Rio Grande LNG Phase 2, and Corpus Christi Stage 3 sit in the queue, and any tightening or loosening of EU sanctions on Russian LNG, which would shift the Russia-share trajectory away from the modeled 40% [S2]. A third trackable node is India's RLNG terminal utilization, which has historically lagged nameplate because of pipeline connectivity rather than LNG availability; closing that gap converts latent import capacity into actual cargo demand and re-tightens the balance faster than supply additions can loosen it. Engineers sizing instrumentation for new regasification or small-scale LNG projects should plan for a market that is structurally loose on paper and operationally tight in any given week, which is exactly the regime that punishes under-specified measurement and rewards modular, hot-swappable PLC I/O with built-in redundancy.
This topic is covered further in Rebar Coupler Selection for Plumbing Installation: Spec-First Criteria.