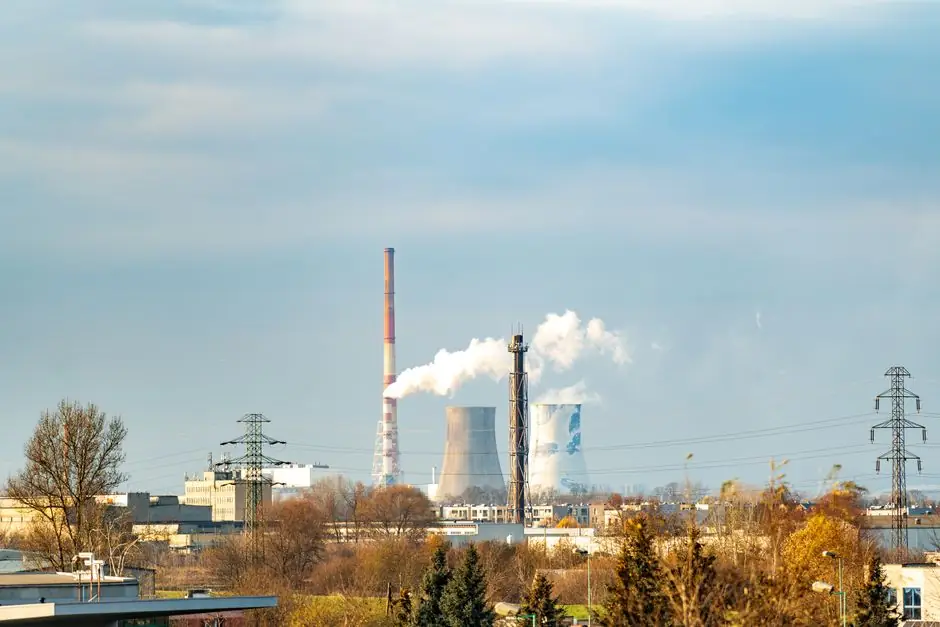
The global nuclear power market is valued at USD 38.30 Bn in 2026, growing at a 4.3% CAGR to USD 51.43 Bn by 2033, while installed generating capacity is 409.90 GW in 2026 on a slower 0.73% CAGR toward 425 GW by 2031 [S1][S5]. The gap between revenue CAGR and capacity CAGR is the single most important fact for spec-driven readers: money is moving into higher-value, smaller, and refurbished plants faster than new megawatts are being commissioned.
Pressurized Water Reactors and Pressurized Heavy Water Reactors together hold 39.3% of the 2026 market by reactor type, while North America leads regional share at 36.2%, supported by policy and financial incentives [S1]. On a capacity basis, pressurized light-water technology leads with 72.8% of installed capacity in 2025, fast breeders are projected at a 21.4% CAGR through 2031, and small reactors below 500 MWe are forecast to grow at 20.1% CAGR to 2031 [S5].
Reactor technology mix and what 39.3% really covers
Pressurized light-water technology accounted for 72.8% of installed capacity in 2025, the dominant operating fleet worldwide [S5]. In the 2026 revenue segmentation, PWR and PHWR combined reach 39.3% market share, a smaller share than the installed-capacity figure because the 39.3% captures reactor-line revenue mix (new builds, services, fuel) rather than the legacy stock [S1][S5].
Medium-sized units in the 500-1,000 MWe class held 49.2% of global nuclear share in 2025, and small reactors below 500 MWe are forecast to grow at 20.1% CAGR through 2031, the fastest of any size bucket tracked [S5]. On fuel, low-enriched uranium accounted for 87.5% of capacity in 2025, with HALEU projected at a 10.9% CAGR through 2031, a slow but steady shift in fuel-cycle strategy that affects enrichment supply chains [S5].
LCOE economics: capital is the lever, not fuel
Capital cost accounts for at least 60% of the levelized cost of electricity for new nuclear plants, with interest charges and construction period as the main variables driving the cost of capital [S2]. Once a plant is built, production cost is low and predictably stable, and operating cost is lower than almost all fossil-fuel competitors, with very low risk of operating-cost inflation [S2].
Fuel is a minor proportion of total generating cost, the opposite profile from gas-fired plants where fuel dominates, which is the structural reason nuclear is treated as a baseload hedge rather than a marginal dispatch unit [S2]. System costs (grid integration, balancing reserves) for nuclear are very much lower than for intermittent renewables, while coal remains economically attractive in jurisdictions where carbon emissions are not fully costed [S2].
Demand pillars: utilities, industry, data centers
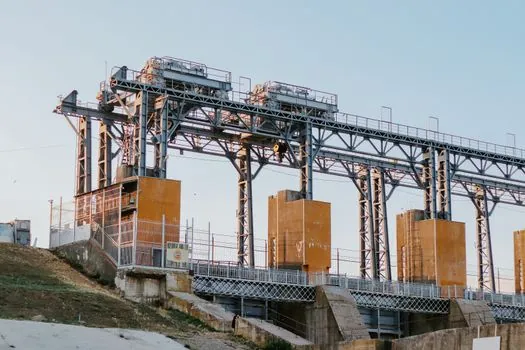
Utilities and IPPs represented 87.7% of nuclear demand in 2025, and grid-connected power was 86.4% of demand in 2025; these two numbers show the legacy buyer base is still dominant [S5]. Industrial and petrochemical application is projected to expand at a 12% CAGR through 2031, and industrial process-heat use is projected at 14.7% CAGR to 2031, the two fastest non-utility lines [S5].
Drivers flagged for incremental CAGR contribution include clean baseload demand (+0.15% to CAGR), advanced SMR commercialization (+0.12%), nuclear-powered data center and marine applications (+0.11%), industrial decarbonization process heat (+0.10%), and nuclear-produced hydrogen and ammonia (+0.09%) [S5]. Lifetime extension and uprate programs add +0.08% on a short-term timeline, concentrated in North America, Europe, and Russia [S5].
Regional split: North America 36.2%, Europe 39.1% of capacity
On the 2026 revenue split, North America leads at an estimated 36.2% share, driven by policy support and financial incentives [S1]. On the 2025 installed-capacity split from a different dataset, Europe held 39.1% of capacity, while Asia-Pacific is the fastest-growing region at 7.2% CAGR through 2031 [S5]. The two cuts are not contradictory: Europe holds older installed GW; North America leads the new-money flow.
Policy anchors cited include France's 2024 energy law mandating six new EPR2 units, the United Kingdom's Great British Nuclear program targeting 24 GW by 2050, and U.S. production tax credits under the Inflation Reduction Act improving project economics in deregulated markets [S5]. These three programs together cover roughly 30 GW of new build and lifetime extension commitment in two mature grids plus one restructured market.
Supply-chain risks: HALEU, sanctions, and fuel security
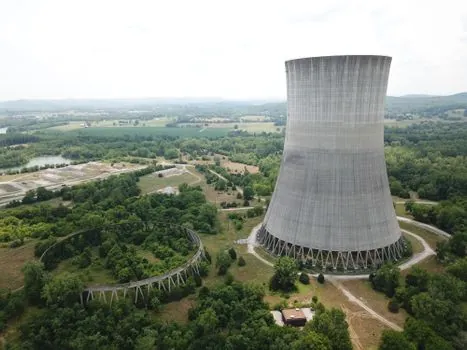
Russia-Ukraine conflict-related sanctions have strained nuclear fuel supply chains, increased cost, and delayed uranium procurement, raising operational costs across the fleet [S1]. The pivot to HALEU at 10.9% CAGR through 2031 is a direct response: it enlarges the addressable market for compact plants but redraws enrichment supply chains [S5].
For buyers of power supply and power distribution equipment tied to nuclear switchyards and plant auxiliary loads, the practical read-through is longer qualification cycles and tighter traceability on sourced components, since the same fuel-security lens is now being applied to balance-of-plant procurement. The EU Green Deal nuclear inclusion debate adds a second-order risk: investment flow and market confidence swing on whether nuclear stays inside the sustainable finance taxonomy [S1].
SMR and advanced reactor track: 20.1% CAGR, 21.4% CAGR
Small reactors below 500 MWe are forecast at a 20.1% CAGR through 2031, and fast breeder reactors are projected at 21.4% CAGR through 2031, the two highest growth lines on the capacity side [S5]. Advanced SMR commercialization is estimated to add +0.12% to global CAGR on a long-term (4+ year) timeline, concentrated in North America, the UK, Eastern Europe, and the Middle East [S5].
The economic rationale is capital cost compression: lower overnight cost per module, factory fabrication, and passive safety systems that shrink the emergency planning zone. The integration of advanced digital controls and AI in plant operations is driving safety and efficiency improvements and supporting lifespan extension of existing reactors, a near-term lever independent of new build [S1].
Comparison: LWR, SMR, fast breeder on four decision axes
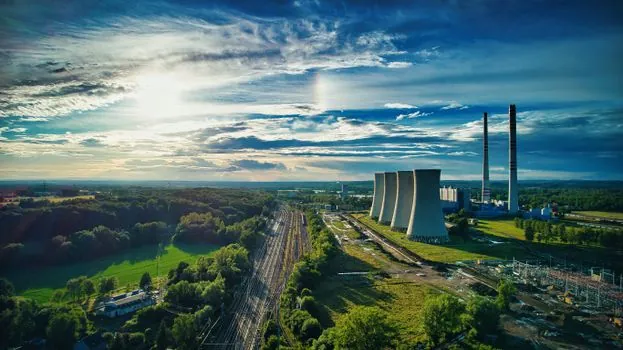
On installed-capacity share in 2025, pressurized light-water technology leads at 72.8%, medium-sized 500-1,000 MWe units hold 49.2% of market share, and small reactors below 500 MWe are a long-tail share today [S5]. On growth rate to 2031, small reactors below 500 MWe are forecast at 20.1% CAGR, fast breeders at 21.4% CAGR, and the overall market at 0.73% CAGR [S5].
On capital intensity, new nuclear carries at least 60% of LCOE in upfront cost, and the structural answer for SMRs is module factory build plus shorter construction windows; for fast breeders the answer is fuel-cycle economics and waste reduction, not overnight cost [S2][S5]. On application fit, LWRs serve the 86.4% grid-connected demand base, SMRs are aimed at the 14.7% CAGR industrial process-heat segment, and fast breeders target fuel-cycle and sodium-cooled industrial use cases [S5].
Failure modes and constraints buyers should price in
Nuclear power plant construction is typical of large infrastructure projects whose costs and delivery challenges tend to be under-estimated, and capital cost dominates LCOE, so financing risk and schedule slippage translate directly into per-MWh cost [S2]. In deregulated wholesale markets, the economic justification for any capital investment has been decreasing while the actual need increases due to the ageing of existing fleets, a structural mismatch between short-term price signals and long-lived assets [S2].
Subsidized intermittent renewables and low-cost gas-fired generation are the main economic risks to existing plants, and the political risk of higher specifically-nuclear taxation adds a second layer, both of which are now standard lines in any plant-economic model [S2]. For process-engineering readers sourcing balance-of-plant kit such as power meter and power cable runs, the practical consequence is that qualification lead times for safety-related and safety-important components have lengthened as nuclear procurement teams re-baseline traceability and counterfeit-parts prevention on the same supply chains hit by sanctions-driven rerouting [S1].
Track next: the HALEU enrichment supply chain ramp (10.9% CAGR through 2031), the first commercial EPR2 and Great British Nuclear award cycles, and any further inclusion or exclusion of nuclear inside the EU sustainable finance taxonomy; these three signals will move the 4.3% revenue CAGR and the 0.73% capacity CAGR more than any other 2026-2027 datapoint [S1][S2][S5].
This topic is covered further in Pallet Stacker Selection for Port Logistics: 2026 Spec Map.