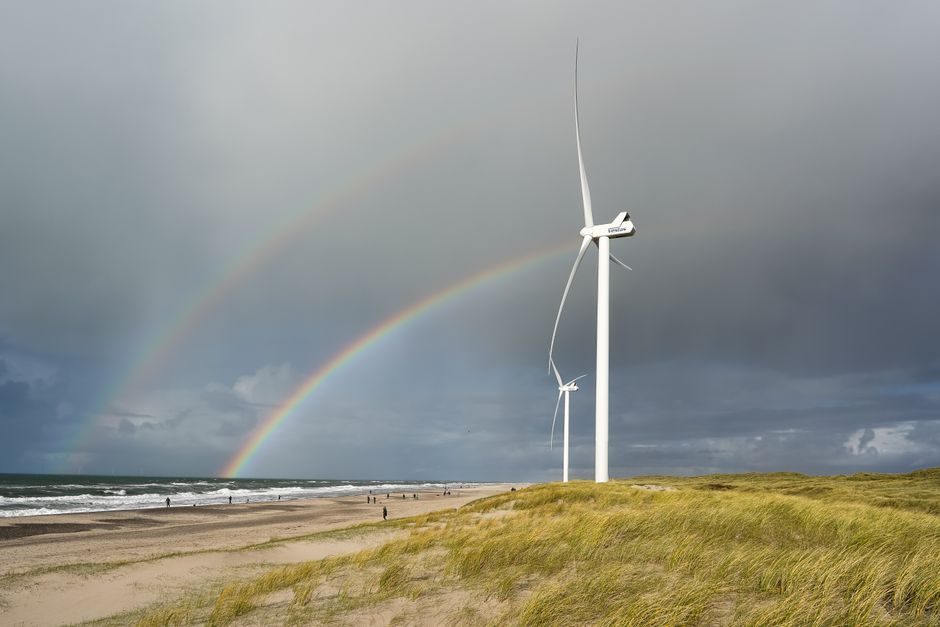
Global fully operational offshore wind capacity reached 80.9 GW as of mid-2025, up 15% from 70.2 GW twelve months earlier, according to RenewableUK's latest Offshore Wind EnergyPulse Insights report [S4].
China holds the largest installed fleet, the UK and Germany anchor the European cluster, and the United States, Taiwan and the Netherlands round out the top tier in most public trackers [S3][S4]. The 80.9 GW figure is for grid-connected operating capacity only; Global Energy Monitor's Global Wind Power Tracker additionally tracks pre-construction and announced phases in the multi-hundred-gigawatt range [S3].
Country Capacity Bands and Rankings
Country-level installed offshore wind capacity is dominated by China, with the UK and Germany holding the next two positions based on cumulative grid-connected megawatts reported in major trackers [S3][S4]. The United States operates roughly 0.1 GW of grid-connected capacity as of early 2025, a figure dwarfed by its deep project pipeline, with Vineyard Wind 1 and Coastal Virginia Offshore Wind representing the first utility-scale US builds [S3].
European cluster members show sharp differences in growth rates: UK offshore generation has historically led global deployment but contracted-for-difference (CfD) auction rounds in 2023 set allocations at zero for offshore wind, a setback that the Pinsent Masons analysis tied to clearing-price economics rather than resource availability [S1]. Offshore wind farms in the German North Sea produced nearly 5% more in 2018 than in the previous year, according to data released by transmission system operator TenneT [S7].
What "Capacity" Means in the Headline Numbers
The 80.9 GW figure refers strictly to fully operational offshore wind farms; it excludes capacity under construction, approved, or announced, which sit several multiples higher across the same reporting period [S4]. GEM's Global Wind Power Tracker separately tabulates "operating," "prospective," and phased capacity, with prospective totals on the order of hundreds of GW when all phases are summed [S3].
Zion Market Research valued the offshore wind energy market at USD 39.89 billion in 2023 and projected a 12% CAGR to USD 110.62 billion by 2032, a market-sizing lens that captures project CAPEX (turbines, foundations, subsea cable infrastructure) rather than installed GW alone [S5]. The 2018 WiseGuyReports forecast used different scoping and should be treated as historical baseline data only [S2].
Market Players and Component Suppliers
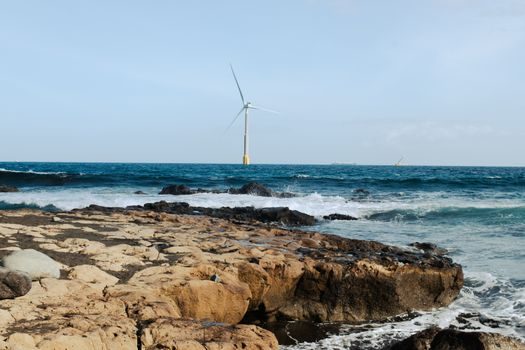
Offshore wind turbine original equipment manufacturers are concentrated in a small set of European and Chinese vendors. Global Market Insights lists Ørsted, Northland Power, Vattenfall, Enercon, General Electric, Siemens Gamesa, Goldwind, MHI-Vestas, IMPSA, Nexans and Prysmian Group as principal market players as of 2020, with developer names (Ørsted, Northland, Vattenfall) distinguished from turbine OEMs (Siemens Gamesa, GE, Goldwind) and cable suppliers (Nexans, Prysmian) [S6].
UK round-3 and Scottish leasing rounds handed site control to developers including Ørsted (formerly DONG Energy), Vattenfall, and Equinor, with the resulting projects feeding the 9-10 GW of UK operating capacity at the time of the 2020 reporting. Cable demand from these projects has direct pull-through for HV subsea pressure transmitter and industrial valve sub-supply, since dynamic-array and export-cable termination hardware requires qualified instrumentation.
Selection Criteria: How Country Numbers Are Compared
Three independent metrics should be cross-checked when reading country rankings: (1) cumulative installed MW of operating farms [S3][S4]; (2) project pipeline MW by phase status (planning, consent, construction, operating) [S3]; (3) annual energy generation in TWh, which captures capacity factor and grid dispatch, not nameplate.
Germany's 5% 2018 output growth is a generation metric, not a capacity metric, and illustrates why output (TWh) and installed (MW) can diverge on a year-to-year basis due to wind resource variability. Reading only installed-MW data can overstate deployment velocity, while reading only generation data can understate fleet expansion in years with low average wind speed.
Policymakers, Project Economics and Country Outlook
Policy design is the single largest determinant of country-level capacity trajectories, with three of the four major European clusters tied to specific support mechanisms. The UK uses a contract-for-difference regime, Germany uses the EEG feed-in tariff framework historically and is now shifting to auction-based tenders, and China uses a national planning-and-FiT hybrid that has driven 20+ GW of domestic capacity [S1]. The 2023 UK AR5 CfD round, which allocated zero offshore capacity, demonstrates that even a mature support scheme can clear at prices unworkable for bidders, temporarily decoupling policy from pipeline [S1].
US offshore wind sits in a different policy regime, with state-level procurement (Massachusetts, New York, New Jersey, Virginia) carrying the load absent a federal production tax credit extension for offshore at the scale seen onshore. Coastal Virginia Offshore Wind and Vineyard Wind 1 are the first two commercial-scale US projects to reach operation, and they together represent a single-digit-GW cohort against a multi-thousand-GW theoretical technical potential [S3].
Trackable Signals for the Next Reporting Window
Three verifiable signals to watch between 2026-07-09 and year-end: (1) the UK AR6 CfD round outcome for offshore wind allocation, which would directly indicate whether the 2023 zero-allocation result is repeated or reversed [S1]; (2) updates to RenewableUK's EnergyPulse Insights dataset beyond the 80.9 GW mid-2025 figure, which would reset the year-on-year growth baseline [S4]; (3) GEM Global Wind Power Tracker phase progression for China and the US, since most incremental GW in 2026-2027 sit in those two jurisdictions' project pipelines [S3].
For related coverage, see How to Choose an Order Picker: Lift, Capacity and Warehouse Spec Bands.