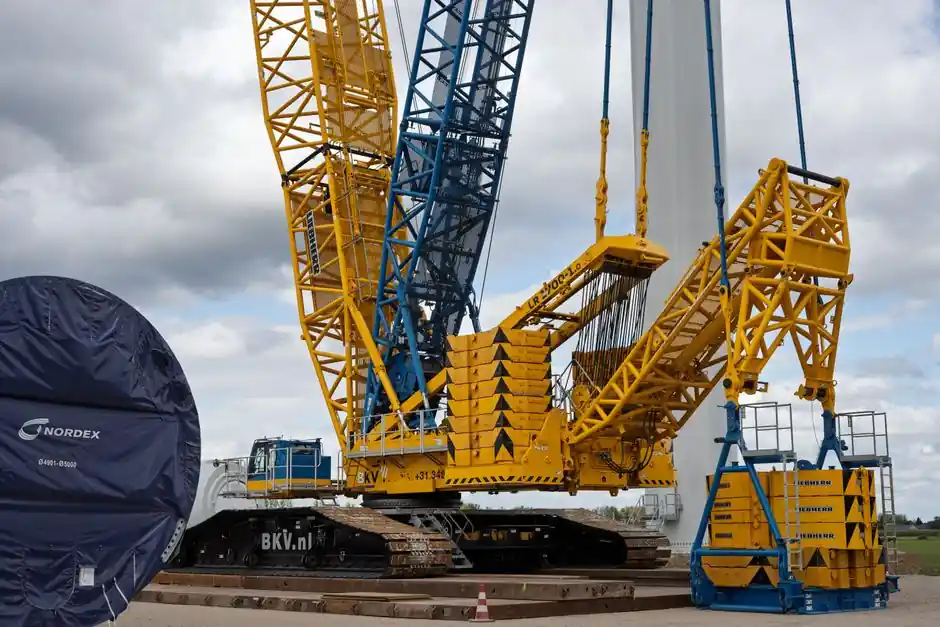
A crawler crane load chart is a multi-curve capacity table that pairs each available boom length with the working radius the hook can reach, then gives the net tonnes the crane is allowed to lift at that intersection [S1][S2].
The two axes that matter for every lift are working radius (horizontal distance from the slewing or track center to the load, in metres or feet) and boom length (the telescopic or lattice section extension, normally 9 m up to 90 m+ on modern crawlers), with chart values normally printed in metric tonnes (t) and on North American charts in short tons (US t) [S2][S8].
What the Chart Actually Plots
A load chart is a manufacturer-issued table derived from structural strength, hydraulic performance, and stability tests, and it is the only document legally allowed to authorise a lift configuration [S1].
For crawler cranes, the chart typically carries three layers of data: a Gross Capacity table indexed by boom length and radius, a Working Range diagram that shows the boom geometry as a side-elevation outline, and a set of Capacity Deductions (hook block, jib, headache ball, rigging, cable) that must be subtracted to reach Net Capacity [S2][S3]. In the UNIC mini-crawler example shown in the load chart FAQ, a boom length of 3.17 m (1 section) at a 3 m working radius allows a lift of 1480 kg [S3].
Why Capacity Falls as Radius and Boom Length Grow
Capacity at any boom length is governed by the moment about the slewing axis, so doubling the radius roughly halves the net load the same boom can carry [S1].
Two mechanical effects drive the curves: with boom angle held constant, a shorter boom has higher rigidity and a shorter moment arm, which raises allowable capacity; with boom length held constant, a lower elevation angle (flatter boom) increases radius and the moment about the centre, lowering capacity [S1]. For crawler cranes specifically, the carrier is also part of the stability equation, so outrigger- and pick-and-carry-style charts on the same machine can show different values for identical radius and boom combinations, and pick-and-carry charts are normally only valid below roughly 2 degrees of ground slope [S1][S3].
Reading a Curve Chart vs a Tabular Chart

Curve-style charts plot radius on the horizontal axis and capacity on the vertical axis, with one curve per boom length; tabular charts reverse that into rows (radius) and columns (boom length) so each cell gives a single rated tonnage [S1][S2].
On a typical 50 t class lattice-boom crawler (Tadano GR-500XL-1 referenced in the Sterling Crane range chart), the chart prints minimum and loaded boom angles in degrees for each (boom length, radius) pair, with the working-area diagram defining the geometric envelope the boom can sweep without striking the tracks or counterweight [S8]. Operators are expected to take the actual radius on site with a laser rangefinder rather than rely on the planned value, because a 0.5 m radius error at full extension is enough to push a borderline lift into the structural-failure zone [S1][S2].
Capacity Deductions and the Gross-to-Net Calculation
Net Capacity is the only number on the chart that limits the lift, and it equals Gross Capacity minus the weight of every item mounted, stowed, or hanging from the boom [S2].
Standard deduction items listed by NCCCO-aligned training material are the main load block, the full load block (if two are carried), jib weight whether stowed or erected, the headache or overhaul ball, all rigging (slings, shackles, spreader bars) and the hanging cable weight; the deduction row is keyed to each boom length because heavier and longer booms require heavier blocks and more reeving [S2]. For a crawler with a stowed 24 ft or 40 ft jib, the load chart also publishes a Stowed Jib Deductions row that must be subtracted for the corresponding boom length before net capacity is compared to the load [S2].
Decision Comparison: Curve, Tabular, and On-Board Calculator

Across decision criteria of operator speed, suitability for jib configurations, and tolerance to radius error, the three chart formats score differently. [S2]
Curve charts are fastest for a single boom length at a time and are the format most OEM operator manuals use, but they become hard to read once a jib is added because the jib curves stack on top of the boom curves [S1][S2]. Tabular charts are slower to scan but handle multiple boom-and-jib combinations in a single page, which is why rental fleet libraries and many European OEM documents default to them [S2][S4]. On-board or web-based calculators, now offered by rental companies and a growing number of OEM telematics portals, let the operator type in radius, boom length, and reeving and return a pass/fail, but the underlying data is still the manufacturer chart, so the calculator is only as good as the model code and counterweight configuration selected [S1][S5].
Limits, Misreads, and Failure Modes
Load charts assume level ground, properly set counterweight, the charted reeving, and the manufacturer's approved hook block, and they lose validity as soon as any of those inputs change. [S1]
Common misreads in the field include swapping charts between crane models, using a rough-terrain chart on a crawler of the same tonnage, ignoring pick-and-carry slope limits, and treating "Rated" or "Gross" as the lift limit instead of Net [S1][S2]. Wind, soft ground, side-loads, and dynamic factors (snatch lifts, two-blocking) all push the real allowable load below the printed value, which is why most OEM safety guidance treats the chart as a starting point and then applies further derates before lifting [S1][S5]. The standard B30.5 mobile- and locomotive-crane rule family and the OEM stability tests are what make the printed numbers defensible in a post-incident investigation, so any chart not tied to those tests is not usable on a regulated site [S1].
Mini and Mid-Range Crawler Reference Points

Mini crawler cranes typically span 1 t to 8 t+ of rated capacity, with the actual figure heavily dependent on the radius shown on the chart, and the same model can lose 30-50% of its close-in capacity by the time the hook reaches mid-range radius [S7].
Mid-range crawlers in the 50-100 t class are well covered in published range charts such as the GR-500XL-1 (50 t) and the larger lattice and telescopic crawlers from Tadano, Kobelco, Link-Belt, Manitowowc, Liebherr and Demag catalogued by North American rental fleets, where capacity steps of 10 t, 20 t, 50 t, 75 t, 100 t, 130 t, 150 t and 200 t are common class sizes [S4][S8]. For planning a lift, the safe workflow is to read the radius off the site survey, pick the smallest boom length that still reaches the pick point, look up the corresponding net capacity in the chart, and then apply wind, ground, and dynamic derates before committing the crane [S1][S5].
Trackable signals: a new mini-crawler range chart revision from UNIC, a renewed ASME B30.5 commentary on crawler stability derates, and a Liebherr / Tadano / Kobelco 200-300 t lattice-boom crawler bulletin in Q4 would each shift the comparison above. For crawler site logistics including haul-road width, gauge, and transport envelopes, see the related crawler crane haul road engineering note, and for the broader equipment taxonomy, the construction machinery and equipment reference and the crawler crane specification page are good starting points.
The underlying component specifications are covered under lifting vehicle.