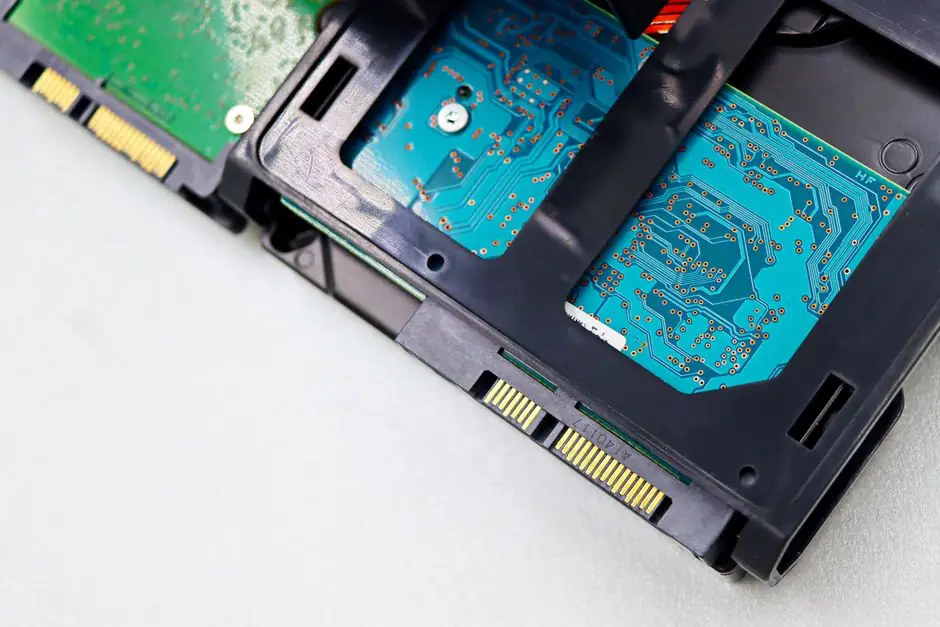
Global data center server market value is projected to grow by USD 273.57 billion between 2026 and 2030 at a 21.2% CAGR, driven by generative AI and large model training workloads [S1]. A second forecast pegs the 2025 base at USD 59.6 billion, expanding to USD 85.2 billion by 2034 at a 3.94% CAGR, reflecting a more conservative, infrastructure-only scope [S5].
Within that envelope, the AI-specific server market is on a steeper curve: USD 142.88 billion in 2024, heading toward USD 837.83 billion by 2030 at a 34.3% CAGR [S6]. The hardware component alone is sized near USD 140 billion in 2025 and approaching USD 900 billion in 2030 [S3]. North America holds the largest regional share at 38.7% in 2025, with rack servers accounting for 46.5% of product mix and commercial servers 64.3% of application mix [S5].
Forecast Triangulation: Why the Numbers Disagree by 4x
The 21.2% CAGR from Technavio and the 3.94% CAGR from IMARC differ because they measure different things: the first bundles accelerator-rich AI systems, the second is closer to general-purpose server revenue [S1][S5]. A third source, Research and Markets, isolates the AI server subset and prints a 34.3% CAGR, the highest of the three [S6]. Deloitte's 2026 outlook adds a fourth anchor, noting that AI compute and storage hardware spending surged 166% year-over-year in Q2 2025 to USD 82 billion, and that global AI infrastructure is expected to reach USD 758 billion by 2029 [S4].
Reconciling the spread matters more than picking a single CAGR. Buyers planning 2027-2028 capex should weight the AI-specific 34.3% curve for accelerator purchases, the 21.2% curve for blended fleet planning, and the 3.94% curve for steady-state replacement budgets, since each captures a different layer of the build-out. Worldwide IT spending was projected to surpass USD 6 trillion in 2026 for the first time, with data center systems the fastest-growing segment [S4].
Three-Market Model: Hyperscaler, Neocloud, Enterprise
AI server demand is separating into three ownership buckets rather than one homogeneous market: hyperscaler-owned hardware, neocloud and third-party AI factory fleets, and enterprise plus private AI factory systems [S3]. Hyperscalers remain the center of gravity, but the marginal dollar of growth is migrating outward as neoclouds finance GPU capacity and rent it back to model labs, and as sovereign buyers build inside their own walls [S3].
This matters for forecasting because one physical cluster now generates four reporting streams: the contract manufacturer books the sale, the neocloud reports the asset and backlog, the hyperscaler reports the lease commitment, and the model lab announces the gigawatt pipeline [S3]. Adding those streams naively produces a total addressable market that does not physically exist. Modeling by owner, with every dollar of server hardware mapped to exactly one owner, is the only way to keep the three buckets mutually exclusive [S3]. Power capacity in gigawatts needs the same discipline, since a contracted megawatt tied to a hyperscaler campus, a neocloud balance sheet, or a sovereign AI factory carries different deployment risk [S3].
Supply Side: DRAM, Accelerators, and the 2026 Component Crunch
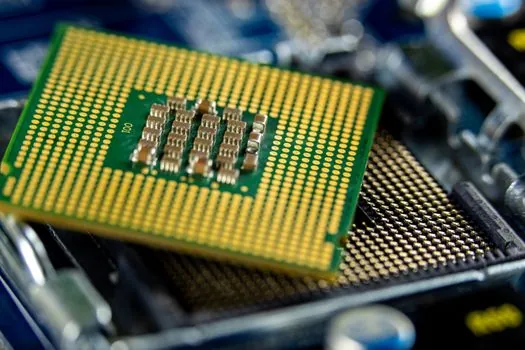
Server DRAM prices surged nearly 95% in early 2026 as AI infrastructure demand consumed global supplies of high-performance components faster than fabs could retool [S7]. IDC projects growth of non-x86 servers to moderate to 36.5% in 2026, still the highest-growth server class as Arm-based and custom-silicon AI hosts pull share [S4]. Global semiconductor revenues were forecast to rise over 22% to USD 772 billion in 2025, then another 25% to USD 975 billion in 2026, driven by AI-optimized processors, edge devices, and high-performance chips [S4].
Electricity consumption in accelerated servers is projected to grow by roughly 30% annually in the IEA base case, making power, not silicon, the binding constraint on how much of this demand can physically be built out [S2]. Rack servers dominate because of their compute density and GPU accelerator compatibility, while micro servers are the fastest-growing product at approximately 5.1% CAGR through 2034, pulled by edge inference and distributed AI workloads [S5]. The architectural shift from general-purpose to workload-optimized systems is forcing enterprises to rebalance performance against power consumption, security, and total cost of ownership [S1].
Regional and Application Mix: Where the Dollars Land
North America is forecast to dominate the data center server market, accounting for 34.6% of growth during the 2026-2030 forecast window, with the United States, Canada, and Mexico as the named geographies [S1]. APAC follows with China, Japan, and India; Europe with Germany, the UK, and France; and the Middle East and Africa with Saudi Arabia, the UAE, and South Africa [S1]. A separate regional cut puts North America at 38.7% revenue share in 2025, Europe at 24.5%, and Asia Pacific at 22.8% [S5].
By application, commercial servers are estimated to witness significant growth through 2030 and lead the segment at 64.3% share in 2025 [S1][S5]. Industrial servers form the smaller second bucket. By form factor, rack servers hold the largest revenue share in 2024, followed by blade, tower, microserver, and Open Compute Project server designs [S1]. End-user split divides into large enterprises and SMEs, with the former historically the larger buyer but the latter growing faster as AI inference moves closer to the edge [S1].
Selection Criteria: Matching the Hardware Class to the Workload
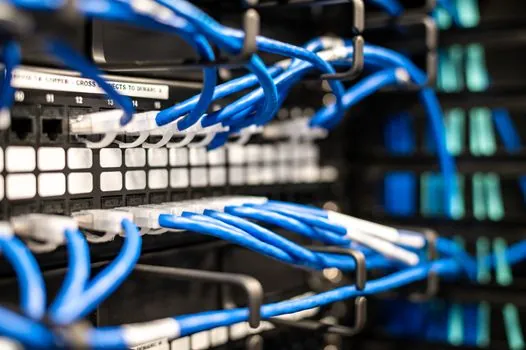
For greenfield AI training campuses, rack servers with high-speed interconnects and low-latency memory are the default, since they deliver the highest workload density per square foot of data center floor space and are compatible with current-generation GPU accelerators [S1][S5]. For virtualized enterprise environments consolidating mixed workloads, blade servers at 24.8% product share remain the higher-density option [S5]. For edge and distributed inference, micro servers at 15.6% share and approximately 5.1% CAGR are the fastest-growing category through 2034 [S5].
For hyperscaler training fleets and neocloud GPU rentals, accelerator-rich non-x86 systems growing at 36.5% in 2026 are the relevant curve, even though they are a subset of the broader 21.2% CAGR blended forecast [S4][S1]. Buyers should also plan for advanced thermal management, since liquid cooling has moved from optional to required for high-density AI racks, and for sub-millisecond latency interconnects where algorithmic trading or real-time inference is the workload [S1]. The trade-off is consistent across all three market buckets: performance, power, and total cost of ownership must be evaluated together, not in isolation [S1].
Limits, Failure Modes, and What the Forecasts Cannot Tell You
None of the published CAGRs disclose the assumed accelerator attach rate, HBM supply curve, or grid-constrained gigawatt ceiling, and those are the variables that will determine whether the 21.2% or the 3.94% curve proves closer to reality [S1][S5]. The 34.3% AI-server CAGR assumes the current accelerator generation ships on schedule, which the 95% server DRAM price spike in early 2026 has already called into question [S6][S7]. Smartphone shipments were projected to potentially contract as much as 5% in 2026 as memory chip shortages and costs weigh on production, a leading indicator that the same component pressure will feed back into server bill of materials [S4].
The three-market ownership model is a methodological fix, not a forecast: it stops double-counting but does not predict which bucket wins the marginal dollar after 2027 [S3]. Power, not silicon, is the binding constraint in the IEA base case, so any forecast that assumes gigawatts are available on demand without a power-purchase contract is structurally optimistic [S2]. Trackable signals to watch through 2027 include quarterly server DRAM contract pricing, hyperscaler capex guidance versus neocloud debt issuance, and the gap between announced and energized AI factory capacity, the same signals that separate the three ownership buckets today.
For component-level specifications, see serial server, architectural hardware, and building pipe hardware.
This topic is covered further in Silicone Rubber Market 2026: Sizing the Spread, HTV vs LSR, and the EV/Medical Pull.