
By end-2023 the global silicon-wafer nameplate stood at roughly 974.2 GW with output near 681.5 GW, of which Chinese mainland capacity was about 953.6 GW (≈97.9% of the world) and output was 668.3 GW (≈98.1% of global) [S2]. The top 10 manufacturers controlled 831 GW of capacity (≈85.5% of the world), and the top 10's output share was 84.8% [S2].
For planning purposes, 182 mm and 210 mm wafers together now hold 98% of the photovoltaic market, while ≤166 mm formats are down to 2%; monocrystalline rod capacity added roughly 400 GW in 2023 alone, with LONGi and TCL Zhonghuan each passing 150 GW [S2]. Outside PV, the specialty-wafer side of the market is being reshaped by Western MEMS and power-device fabs targeting 200 mm and below — a different geometry game entirely.
Solar-Grade Wafer Sizing and Thinning Windows
Large-format dominance (182 mm + 210 mm at 98% share) and rectangular-geometry emergence — micro-rectangular at 20.3% and rectangular at 10% — mean a planner sizing a 2026 mono-Si line is no longer choosing between M6 and M10; the choice is between G12 round, G12R rectangular, and 166 mm legacy [S2]. Wafer thinning has decelerated: average p-type mono-Si is around 150 µm (−5 µm vs 2022), TOPCon n-type is 125 µm, and heterojunction n-type is 120 µm (−15 µm and −5 µm respectively versus 2022) [S2].
Thinning-rate reduction matters because kerf-loss yield, bow-wafer breakage at 120–125 µm, and cell-efficiency gains no longer compound the way they did between 2021 and 2022, when TOPCon and HJT each dropped 20–25 µm in a single year [S2]. A planner budgeting 2026 diamond-wire and HJT roadmaps should expect single-digit-micron annual reductions, not double-digit jumps. The cost case for further thinning is now driven by silver-paste savings per wafer, not by silicon consumption alone.
Fluidized-Bed Reactor (FBR) Polysilicon and Inline Flow Control
Fluidized bed reactor (FBR) polysilicon — the Siemens-alternative process using preheated hydrogen or helium to deposit pure silicon onto seed particles — is the lowest-energy route to solar-grade feedstock and the most common alternative to Siemens-process polysilicon [S1]. Variability in incoming raw-material flow is the dominant process upset, so inline flow measurement is a hard requirement rather than a nice-to-have [S1].
For FBR gas-service rotameters, the spec envelope that matters is 0.42 to 1050 SCFM (0.95 to 550 GPM liquid) with 1.6% of full-scale accuracy at qG = 50%, 316L stainless steel wetted parts, 4–20 mA plus optional HART output, and FM/ATEX intrinsic-safety certification for hydrogen-handling areas [S1]. The display and the 4-20 mA feedback loop let the operator trim carrier-gas flow as reactor loading shifts — exactly the kind of closed-loop trim a 1000 GW-class FBR fleet needs to stay energy-competitive. Inline flow meter selection here is a process-safety decision as much as a measurement decision.
200 mm MEMS/Power Specialty Capacity: The Okmetic Build-Out
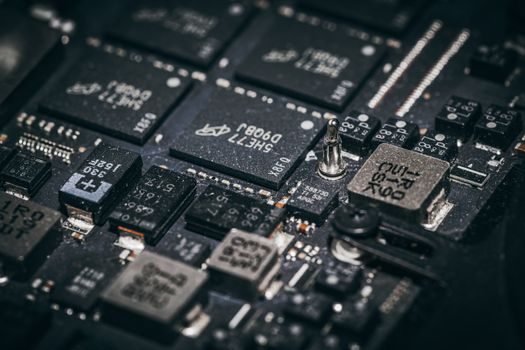
Outside PV, the 150–200 mm specialty-wafer market is consolidating around a few Western sites. Okmetic's Vantaa fab in Finland runs crystal growth and SSP, DSP, and bonded SOI wafer production, and the announced 200 mm fab expansion will more than double Okmetic's 200 mm capacity from 2025 onwards [S3]. The site also handles in-house lithographic patterning and deep reactive-ion etching (DRIE), which is what separates a specialty wafer vendor from a commodity one [S3].
For buyers of 200 mm silicon wafer substrates targeting MEMS, RF, and power devices, the practical implications are shorter lead times on bonded SOI, BSOI, and engineered high-resistivity wafers, and a wider 300 mm and epi offering through partner fabs rather than direct in-house production [S3]. When a planner is qualifying a second source for a 200 mm RF or power-device line, Okmetic's 2025-onwards capacity doubling is a meaningful de-risking event.
8-Inch and 12-Inch Semiconductor Wafer Projects in China
On the semiconductor side, the Hangzhou Zhongxin Wafer Semiconductor large silicon-wafer project completed construction in 1 year 8 months and formally began mass production of 8-inch wafers on 2019-11-22, with the 12-inch production line following [S5]. For a planner modeling China's 8-inch/12-inch domestic-substrate ramp, the project's ~20-month greenfield-to-mass-production cycle is the reference benchmark for new fab scheduling on the Qiantang New District model [S5].
That ramp is consistent with mainland wafer-capacity dominance: end-2023 mainland capacity of 953.6 GW against global 974.2 GW, with mainland exports of about US$4.86 billion (−4.1% YoY) on 70.3 GW of export volume (+93.7% YoY), or roughly 10.5% of mainland output [S2]. Export volume more than offset export-value decline, implying ASP compression of about 50% YoY at the port — a number any 2026 import-substitution plan has to internalize.
Cost-Engine Sizing: Equipment Vendors Pushing Back Into Wafers
Equipment-side players are crossing back into the wafer business. In 2023, new entrants with crystal-pulling or slicing backgrounds — including Shuangliang, Hysolar, Meike, and Gokin — added monocrystalline capacity at a pace that pushed total monocrystalline rod capacity up nearly 400 GW versus end-2022 [S2]. Shuangliang's 2023 Q3 alone booked revenue of 6.659 billion yuan (+49.68% YoY), with gross margin 20.44% and net margin 12.31% as silicon-wafer shipment scale rebounded and line operating rates recovered [S6]. Earlier 2023 Q1/Q2 figures showed revenue of 970 million yuan (+57.05% YoY) and 528.50% net-profit growth as utilization recovered from the silicon-price downcycle [S7].
For a planner, the consequence is that equipment-vendor-integrated wafer capacity behaves differently under capex cycles: it tends to ramp faster (because crystal-pullers and slicers are in-house) but with thinner per-wafer cost buffers when polysilicon prices fall. The 78.8% YoY output growth against 46.7% capacity growth in 2023 [S2] is the signature of that operating-rate recovery — and it sets the upper bound on how much new nameplate can be absorbed before price discipline breaks.
Decision Matrix: PV Mono-Si vs FBR Polysilicon vs 200 mm Specialty
On three core planning axes — wafer-geometry lock-in, cost-engine sensitivity, and end-market exposure — the three segments diverge sharply. PV mono-Si is locked to 182/210 mm round or rectangular formats at 120–150 µm thickness, with cost sensitivity dominated by silver paste and diamond-wire consumption; FBR polysilicon is format-agnostic upstream but format-locked downstream by the wafer-cell customer, with cost sensitivity dominated by hydrogen and electricity intensity; 200 mm specialty is geometry-fixed at 150–200 mm, with cost sensitivity dominated by SOI bonding yield and DRIE process time [S1][S2][S3].
For a utility-scale PV build, mono-Si is the default; for a polysilicon asset, FBR's energy edge is the only durable margin lever; for a 200 mm MEMS or GaN-on-Si RF line, the planner's binding constraint is bonded-SOI and high-resistivity wafer supply, not raw poly — exactly the slot the Okmetic 200 mm doubling is meant to fill [S3]. The table below condenses the decision logic.
Planning Risks and Failure Modes for 2026
Three failure modes dominate 2026 wafer-planning risk. First, overshoot: end-2023 capacity of 974.2 GW already exceeds plausible 2026 demand at current utilization, so any nameplate that comes online ahead of n-type TOPCon/HJT cell ramp will be priced as a 150 µm commodity [S2]. Second, format mismatch: 166 mm and below now hold only 2% of the PV market [S2], so legacy lines without 182/210 mm conversion paths are stranded. Third, thinning yield: 120 µm HJT and 125 µm TOPCon wafers break differently during cell printing, and breakage-rate variance at those thicknesses is the biggest single hit to per-wafer cost-down roadmaps [S2].
Equipment-vendor-integrated entrants also carry a higher risk of capacity dump pricing during silicon-price troughs, given the in-house capex amortization model [S2]. On the FBR side, hydrogen-handling-area certification (ATEX/FM IS) is non-negotiable for rotameters and inline flow instrumentation, and the meter body must be 316L SS to survive monosilane and HCl trace exposure [S1]. For bonded-SOI and high-resistivity 200 mm wafers, the constraint is qualified-vendor count — currently thin — which is why the Okmetic 2025-onwards doubling is a load-bearing event for Western MEMS and power roadmaps [S3].
Standards and Sourcing Anchors
The dominant planning numbers are: 974.2 GW global nameplate (end-2023), 953.6 GW in Chinese mainland (97.9%), 831 GW from the top 10 (85.5%), 668.3 GW mainland output (98.1% of global), 70.3 GW mainland export volume (+93.7% YoY), and US$4.86 billion mainland export value (−4.1% YoY) [S2]. Thinning baselines for cell-engineering models are p-type 150 µm, TOPCon n-type 125 µm, and HJT n-type 120 µm [S2]. FBR rotameter specs to anchor on: 0.42–1050 SCFM, 1.6% of FS accuracy at 50% qG, 316L SS, 4–20 mA + HART, ATEX/FM IS [S1]. 200 mm specialty-wafer supply is concentrated in Vantaa with capacity doubling from 2025 [S3].
Watch for Q1 2026 Okmetic 200 mm ramp updates, mainland 12-inch line yield disclosures from the Hangzhou Zhongxin cohort, and any incremental disclosure on Shuangliang-class equipment-vendor wafer output [S3][S5][S6]. Cross-reference on robotics-and-automation supplier capacity that feeds wafer-handling — see the delta robot price 2026 spec-to-cost breakdown for the kind of pick-and-place budgeting that goes alongside a 200 mm line.
The underlying component specifications are covered under silicon nitride.