
SMED programs in practice take 30 to 60 percent off changeover time, and Shigeo Shingo's documented cross-industry work averaged a 94 percent cut, for example 90 minutes down to under 5 [S3][S4].
The mechanism is mechanical, not motivational: every minute the line is stopped for a product swap is a minute of lost capacity in the OEE Availability factor, so shortening that window raises Availability directly while the Standardized startup procedure trims startup scrap in the Quality factor [S2][S4].
Where SMED Sits in the OEE Loss Tree
OEE is the product of Availability x Performance x Quality, and on most discrete lines changeover and setup are the largest or second-largest Availability loss, frequently outweighed only by unplanned downtime [S3][S4]. A worked example: a line running three changeovers per shift at 45 minutes each loses 135 minutes, roughly 30 percent of an 8 hour shift, just to setup, so a 25 minute per-changeover SMED outcome returns 60 minutes per shift, about a 12.5 percent OEE gain from the Availability bucket alone [S3].
The classic six-big-losses taxonomy from OEE research groups changeover under "Setup and Adjustments," and pairing OEE tracking with Downtime Reason Codes that include a dedicated changeover code is the prerequisite for diagnosing whether SMED is the highest-ROI lever on a given asset [S4]. Operators running mixed-model lines typically see Setup and Adjustments climb above 10 percent of planned production time once batch size drops below a few hours of throughput, which is the trigger range where SMED almost always beats the alternative of buying a duplicate machine [S3][S7].
The Three Stage Mechanics and Typical Reduction Bands
Shingo's framework has three sequential stages, each with its own reduction band: Stage 1 separates internal and external setup, and the act of reclassifying activities alone removes 30 to 40 percent of changeover time because 30 to 50 percent of activities currently done with the machine stopped can be moved offline without equipment changes [S2][S3]. Stage 2 converts internal activities to external through standardized tool heights, quick-connect fittings, pre-heated dies, intermediate jigs, and pre-set toolholders that carry calibration offline; this stage typically delivers the largest absolute cuts and usually requires modest engineering spend [S2]. Stage 3 streamlines the residue: quarter-turn fasteners, color-coded tooling, shadow boards, checklists, and trial-run elimination through first-piece guarantee procedures [S2][S3].
The 30 to 60 percent outcome band from structured SMED work reconciles with Shingo's 94 percent average only by recognizing that Shingo's dataset includes mature, multi-iteration programs, often a 20x reduction, while a first-pass pilot on a single asset more typically lands in the lower half of that band [S3][S4]. The NASCAR tire-change analogy captures the upper bound: 15 minutes per tire for an amateur versus four tires in under 15 seconds for a coordinated crew, both performing the same physical work, with the gain coming from pre-staging, parallel execution, and standardized choreography [S4].
Quantifying the Flow Side, Not Just Availability

The OEE Availability gain is the easiest line item to defend with numbers, but the second-order effect on flow is often larger in dollar terms. Shorter changeovers enable smaller lot sizes, which in turn let production match real demand without buffer inventory, dropping WIP and finished-goods carrying cost while improving on-time delivery [S1][S4]. Standardized changeover procedures also reduce startup scrap, the Quality side of OEE, because the first-piece-after-changeover failure rate drops when trial-and-error adjustment loops are removed [S2].
For an engineer sizing a CAPEX request, the SMED business case is straightforward: every minute of avoided changeover time is recovered capacity on the same asset, so a line that gains one hour per shift from SMED work offsets the purchase of roughly 12.5 percent of a duplicate machine running one shift, without the building, controls, or maintenance overhead [S3]. Real-time OEE software makes this auditable because changeover events are captured automatically instead of relying on stopwatch time studies, which are known to suffer observer bias and to capture atypical events when operators know they are being watched [S3][S8].
Selection Criteria: When SMED Fits and When It Does Not
SMED is a fit on any discrete-asset line that runs repeated changeovers between distinct product variants, and it is the highest-ROI OEE lever when Setup and Adjustments is the dominant Availability loss and demand mix requires frequent switches [S3][S4]. It is a weak fit, or actively counterproductive, on continuous processes with infrequent grade changes, on assets already running near theoretical capacity, and on lines where the changeover loss is small relative to chronic micro-stoppages that no SMED intervention will touch [S4]. SMED also should not be the first priority if the plant lacks basic production-data visibility: the lean-production guidance is explicit that hard data on where time is lost has to come before the SMED project charter is approved, which is why the Six Big Losses and a Downtime Reason Code dictionary are prerequisites [S4].
For mixed-model and high-variation lines, the OEE in continuous process industries adaptation guide is the relevant companion read because it covers the modifications required when SMED is applied to batch chemical or process assets where "changeover" means a grade transition rather than a die swap. For cutting-heavy production environments, the Semi-Auto vs Manual Cold Saw for Production Cutting reference is the natural cross-link because blade and vise changeover is a textbook SMED candidate on those assets.
Comparison: SMED Stages Against Decision Criteria
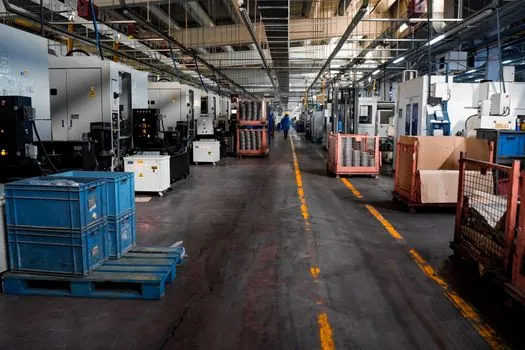
A practical comparison for engineers planning a SMED rollout: Stage 1 typically requires zero CAPEX, takes one to two changeover events to study, and delivers 30 to 40 percent reduction; Stage 2 typically needs modest engineering (quick-connects, standardized tool heights, pre-staged tooling kits) and 2 to 6 weeks of design and installation; Stage 3 is iterative Kaizen work on residue waste, runs continuously, and is where the upper half of the 30 to 60 percent band is reached. Across the three stages, the data-capture requirement scales up: Stage 1 works on a stopwatch, Stage 2 benefits from video and time-stamped event logs, and Stage 3 requires continuous automated changeover event capture to avoid operator bias and to confirm the Standardized procedure is being followed on every shift [S2][S3][S8].
On data infrastructure, real-time OEE tracking changes which stages are even measurable, because automated changeover detection removes the manual time-study bottleneck and lets Stage 3 improvements be validated across hundreds of events rather than a handful of observed swaps [S3][S8]. The Guidewheel practical guide published in May 2026 frames SMED and real-time monitoring as a single workflow rather than two separate programs, with changeover time as a first-class metric alongside Availability, Performance, and Quality [S8].
Implementation Pitfalls and Failure Modes
Three failure modes recur across published SMED work. First, treating Stage 1 reclassification as the whole project: the 30 to 40 percent gain from separating internal and external activities is the easy early win, but stopping there leaves the largest remaining waste untouched and produces a flat improvement curve [S2][S3]. Second, skipping the data infrastructure and relying on stopwatch studies: this biases results upward because operators behave differently when observed, and the resulting "improved" changeover time may not persist across shifts [S3][S4]. Third, attempting SMED on an asset where changeover is not actually the dominant Availability loss, which produces small absolute gains and burns program credibility [S4].
A secondary failure mode is operator resistance: Standardized changeover procedures reduce operator autonomy, and successful SMED rollouts pair the engineering work with explicit operator involvement in designing the Standardized steps, plus visual management (shadow boards, color-coded tooling) that makes the new procedure self-enforcing [S2][S5]. The IMEC February 2026 manufacturing-extension guidance emphasizes that SMED works by shifting setup tasks offline and streamlining operations rather than by asking operators to move faster, a distinction that determines whether the program sustains or regresses [S5].
Standards, Data, and What to Track
SMED itself is not governed by an ISO or IEC standard; it is a methodology originating from the Toyota Production System and documented in Shigeo Shingo's A Revolution in Manufacturing: The SMED System, with operational-excellence recognition through the Shingo Prize administered by Utah State University [S1]. The relevant standards-adjacent framework is the OEE calculation itself, which is conventionally broken into Availability x Performance x Quality with the Six Big Losses taxonomy attributing Setup and Adjustments as a named Availability loss bucket [S3][S4]. For plants that need to track changeover time as a first-class metric, the practical data model is a Downtime Reason Code dictionary with a dedicated changeover code, machine-state timestamps from the PLC or edge sensor, and an OEE dashboard that exposes changeover loss separately from unplanned downtime [S4][S8].
The near-term trackable signal is the median changeover time per SKU family on a target asset, with the success threshold being a sustained sub-10-minute result on at least one product family within six months of project kickoff, which is the "single-minute" benchmark Shingo set at Toyota [S1][S4]. A second trackable signal is the Availability factor in the rolling 30-day OEE, which should move by approximately the percentage of total changeover time removed, with a realistic ceiling in the 5 to 15 percent range for a first-pass SMED project and additional gains available only through Stage 3 Kaizen work [S3][S4][S8].
Component reference pages worth checking: time relay, impact drill, and air impact wrench.