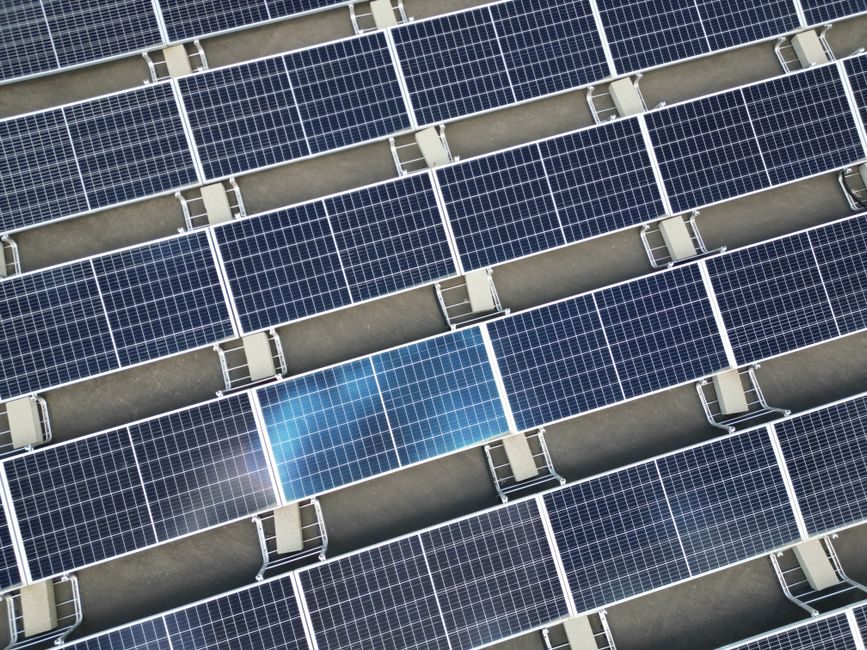
2026 is the first year in over a decade forecast to deliver negative global PV module demand growth, with InfoLink's January-2026 outlook pegging 2026 module demand at 529-624 GWdc against 2025's 653-706 GWdc [S3]. That demand contraction sits on top of a polysilicon sector running at roughly 44% average utilization with a peak monthly utilization of only ~56% across 2025, a silver-price shock that has pushed up cell and module unit costs, and an accelerating wave of U.S. and EU trade localization that is redrawing where cells and modules can be physically built [S3].
The combination is not a classical "cell shortage" in the sense of empty warehouses. It is a structural risk: the bottleneck has shifted from silicon wafer volume to silver paste, localization eligibility, and bankable module supply, which is where procurement and EPC teams will feel the pain through 2026 and into 2027 [S3][S4].
2026 Demand Trough and Why It Looks Like a Shortage
Negative module-demand growth of 529-624 GWdc in 2026 versus 653-706 GWdc in 2025 directly implies cell-level wafer demand destruction of roughly 124-177 GWdc-equivalent year-on-year, the first such pullback since the 2011-2012 poly bust [S3]. China and the U.S. are the principal demand headwinds: the 14th Five-Year Plan wrap-up, Document No. 136, and the Distributed PV Power Generation Development and Construction Management Measures have cooled the Chinese distributed-PV pipeline, while U.S. demand "fell short of earlier expectations" in 2025 and is not expected to rebound sharply in 2026 [S3].
For a procurement engineer, the practical translation is that 2026 cell availability is not wafer-constrained at the industry level; it is constrained by what fits the localization and antidumping/countervailing-duty (AD/CVD) envelope of the buyer. Banks financing projects increasingly demand tariff-compliant modules, which routes demand away from the lowest-cost cell and toward the most paperwork-clean cell [S3][S4].
Silver-Paste and Front-Side Metallization: The Real Cell-Level Choke Point
Silver is the most acute 2026 cell-cost shock. InfoLink's 2026 outlook explicitly identifies "a sharp surge in silver prices" as pushing up cell and module costs and feeding anti-price-war momentum, with silver-paste consumption of 80-130 mg per cell (depending on TOPCon vs. PERC vs. HJT architecture) now a larger share of cell BoM than polysilicon itself on a $/W basis [S3].
Mitigation is technically proven but slow: copper plating, silver-aluminum pastes, and reduced busbar counts (9BB/12BB/16BB, SMBB, 0BB) are entering mass production, but qualified capacity is still a single-digit percentage of total cell lines in 2026 [S3]. For specifiers, the cell-level spec to watch on a datasheet is the silver loading in mg/cell and the busbar count, not the panel wattage alone; those two numbers now dominate 2026 cell cost variance more than the cell efficiency number printed on the label.
Polysilicon, Wafers, and the Effective-Overcapacity Hangover
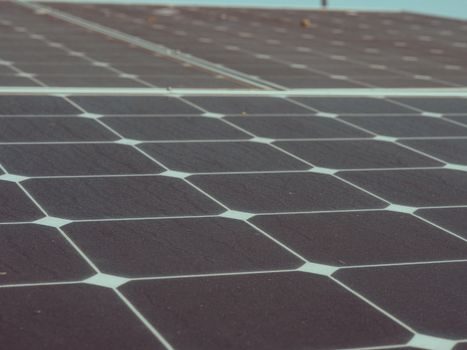
Polysilicon output for 2025 is estimated at approximately 726 GW (converted), with an average utilization rate of around 44% and a peak monthly utilization of only about 56%, a level of effective overcapacity that has frozen new capex and pushed restructuring to the top of the 2026 agenda [S3]. Wafer and cell segments are running cooler, with non-leading producers parking lines and tier-2 cell makers exiting TOPCon conversion projects that no longer pencil out at current silver-plus-power prices [S3].
The supply-chain consequence is bipolar: large integrated groups (poly + wafer + cell + module) can still bid defensively into projects, while merchant cell-only lines are starved of cash and exit. Buyers who single-source from a tier-2 cell-only maker carry elevated 2026 delivery risk; the structural-insolvency failure modes seen in 2024-2025 have not fully cleared [S3][S7].
Localization, Tariffs, and the AD/CVD Overhang
Deglobalization is now the single largest non-silver supply-chain variable. U.S. solar manufacturing in 2026 sits in an "odd position" with all five major components (polysilicon, ingots, wafers, cells, modules) being domestically produced for the first time since SolarWorld closed its Oregon wafer plant in 2013, but glass remains the chink in the armor and trade-policy uncertainty layers fresh risk on top of reshoring gains [S8]. Tariff exposure, AD/CVD circumvention probes, and forced-labor enforcement are listed by Allianz as the #4 risk driver in its 2026 Risk Barometer for the solar sector, with the share of respondents citing legislative/regulatory change rising sharply versus prior years [S7].
For project-level sourcing, this means that an EPC bidding a U.S.- or EU-located utility-scale plant in 2026 must verify module bill-of-materials against the applicable country-of-origin rules, not just the panel datasheet. A module physically built in Southeast Asia from Chinese wafers can fail the documentation chain under tightening U.S. AD/CVD enforcement even though the cell is electrically identical to a compliant unit [S4][S8]. This is the kind of "shortage" that does not show up in GWdc numbers but can stop a project at the customs gate. Cross-referencing the upstream-downstream view in the 2026 solar inverter sourcing map clarifies how inverter OEMs are routing around the same AD/CVD rules and where inverter-bankability criteria diverge from module-bankability criteria.
Failure Modes: Degradation, Fire, and Bankability
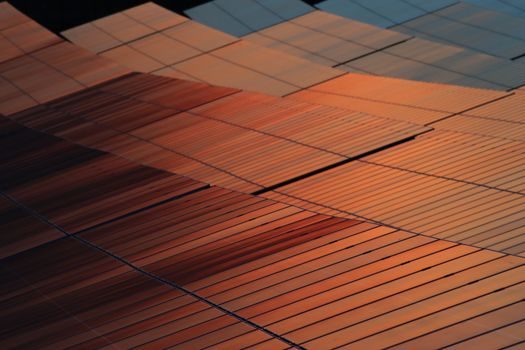
Technical risk has not gone away. Potential-Induced Degradation (PID) under high system voltage (600-1500 V) can produce 20-30% power loss within 2-5 years if unmitigated, with the highest exposure on negatively grounded strings in coastal/tropical humidity, which is exactly the climate where many 2026 distributed-PV projects are being sited [S6]. The module-level fix is double-glass construction, anti-PID encapsulant, and positive grounding, but those choices interact with the 2026 supply squeeze: not every anti-PID SKU is available with every cell-source configuration [S6].
Fire risk remains statistically small. Fewer than 1 in 10,000 installed systems are linked to a fire in a given year, and the dominant ignition source is bad wiring, poor installation, or cheap connectors, not the silicon cell itself [S5]. Even so, the NEC rapid-shutdown and arc-fault requirements that drive most of the fire-risk delta continue to tighten, and a cell change that requires a new junction-box layout can invalidate a module's UL 61730 / IEC 61730 listing on a project already in flight [S5]. For the specifier, this is the "second shortage": even when you have cells, you may not have the listed-and-labeled SKU the project was permitted under. The same bankability and traceability logic that applies to inverters, as detailed in the 2026 solar inverter manufacturer sourcing map, now reaches all the way down to the silver-paste batch.
What Specifiers and Buyers Should Track in H2 2026
Three signals will tell you whether 2026 resolves into a soft landing or a hard squeeze. First, weekly Shanghai Silver Exchange spot versus LBMA fixings, because each 10% silver move shifts cell ASP by roughly 0.4-0.6% and is the fastest-moving cost input on the BoM [S3]. Second, monthly U.S. Customs and Border Protection withhold-release-order (WRO) and AD/CVD circumvention findings, because each enforcement action reshuffles the compliant supply pool overnight [S7][S8]. Third, InfoLink's monthly polysilicon utilization reading, where a sustained move above 60% would be the first sign that the 2025 overcapacity is being digested and that 2027 pricing power is returning to cell makers rather than module assemblers [S3].
Operationally, the move through H2 2026 is to dual-source cells across at least two geographic production clusters, lock silver-paste loading and busbar count into module procurement specs rather than treating them as OEM-choose, and validate country-of-origin documentation against the destination market's AD/CVD and localization rules before, not after, the module PO is signed [S3][S4][S8].
For component-level specifications, see load cell, dc power supply, and load cell module.