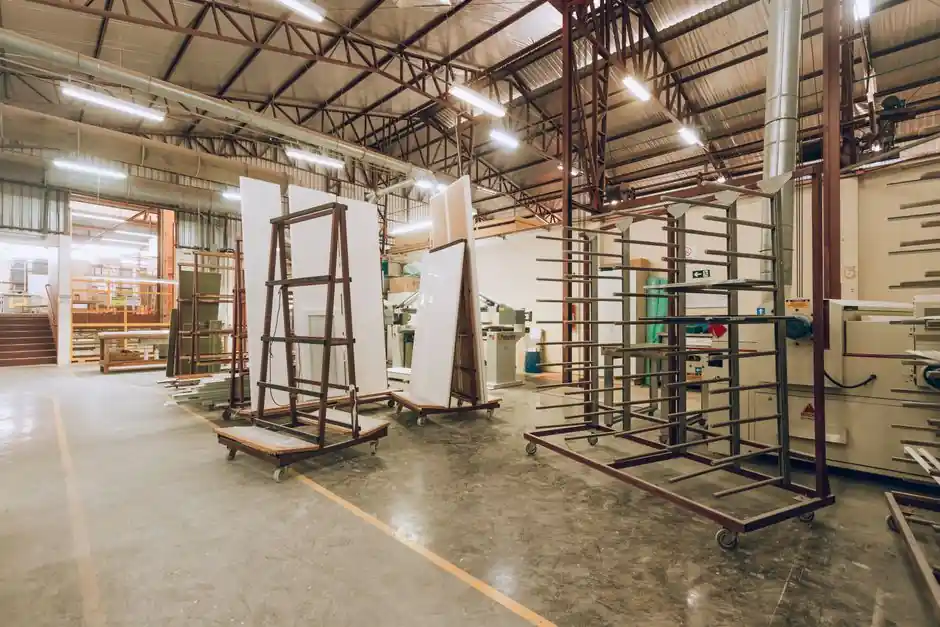
Public 2026 cost benchmarks put solar inverters at $0.10-$0.25 per watt, or $0.15-$0.24/W on a more conservative retail spread, with central/string units in the lower band and microinverters at the top [S4][S6]. Behind that sticker price, the National Laboratory of the Rockies (formerly NREL) tracks manufacturing cost as four layered buckets: direct BoM, process labor and overhead, SG&A plus R&D, and financing/profit margin, the same stack used to compute Minimum Sustainable Price (MSP) [S1].
Replacement-cycle data reinforces why the BoM matters: inverters are the shortest-lived major component in a PV plant, with 10-15 year service life versus 25+ years for modules, and commercial replacement invoices in 2026 are landing $5,000-$30,000 per swap [S3]. That asymmetry between hardware cost share and lifetime cost-of-ownership is the single biggest reason procurement teams treat inverter cost decomposition as a strategic question rather than a line item.
What "manufacturing cost" actually means in 2026 cost models
The NLR bottom-up cost framework breaks an inverter into four auditable layers: direct materials (semiconductors, magnetics, capacitors, enclosure, thermal stack, PCBA), conversion cost (labor, equipment depreciation, factory overhead), corporate overhead (R&D, SG&A), and a financing plus profit wedge that lands on the Minimum Sustainable Price [S1]. Each layer is independently varied in the Detailed Cost Analysis Model (DCAM) so a 10% IGBT spot-price move, a 15% labor delta, or a certification add can be replayed without re-baselining the rest of the stack [S1].
For procurement, this matters because bill-of-materials cost is the lever you can actually move: labor rates are mostly geographic, and SG&A is fixed. A typical three-phase string inverter BoM sits around 60-70% of factory cost, with IGBTs/MOSFETs, the LCL filter inductor, the high-frequency transformer, and the DC-link capacitor bank dominating the spend line. That figure is consistent with NLR's published guidance that materials, equipment, facilities, energy, and labor are tracked separately for each process step [S1].
BoM cost drivers, ranked
Power semiconductors are the single largest cost line in any inverter BoM, with the IGBT module or SiC MOSFET half-bridge typically running 18-25% of total BoM for a 50-100 kW three-phase string unit. Wide-bandgap SiC devices command a meaningful premium per amp but shrink the magnetic and cooling bill, which is the trade-off procurement teams should be scoring rather than chasing the headline SiC price tag. Below the switches, the LCL filter (3-5% of BoM), high-frequency transformer or PFC choke (4-7%), and the DC-link film capacitor bank (3-6%) are the next tier of items that move on commodity cycles [S1].
Enclosure, heatsink, and thermal interface materials add another 8-12% combined, and the gate-driver board plus control PCBA (DSP/MCU, isolated gate drivers, current sensors, communication modbus/Ethernet) typically lands at 10-15%. Standards-driven overhead also shows up here: UL 1741, IEEE 1547, and IEC 62109 certification cycles, plus grid-support features mandated by Rule 21 and UL 1741-SB in California-type jurisdictions, push firmware validation cost and EMC rework into the BoM. Two cross-cutting cost facts: total inverter hardware is roughly 6-12% of a turnkey residential system and 8-15% of a commercial installed price, so a 20% inverter BoM reduction translates to only a 1-3% turnkey saving for the EPC [S2][S3][S7].
Labor, SG&A, and the Minimum Sustainable Price wedge
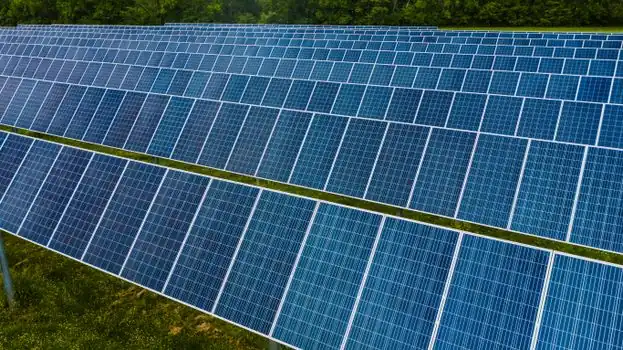
Process labor and factory overhead run 8-14% of factory cost in NLR's published cost stacks for similar power-electronics assemblies, with the heavier end landing on lines doing more hand assembly and toroidal winding [S1]. The NLR cost analysis also separates country-specific labor and energy costs, so a U.S. assembly line typically lands 15-30% above a comparable Southeast Asian line on the same BoM, a gap that has narrowed since 2022 as U.S. utility-scale demand pulled regional capacity online [S1].
SG&A plus R&D is where vendors differ most. Larger tier-one string and central inverter vendors amortize firmware, grid-compliance, and warranty over a wider unit base, which is why per-unit SG&A looks 30-50% lower than for boutique hybrid inverter brands. The financing-plus-profit line then sits on top, yielding the Minimum Sustainable Price that NLR defines as direct COGS plus overhead plus the cost of debt and equity plus a margin for stakeholders [S1]. For buyers, the practical read is that quoted 2026 prices around $0.10-$0.25/W already sit near MSP for the high-volume string and central segments, and that further price compression will have to come from BoM, not margin.
Inverter type comparison on cost-driving criteria
Comparing the four main architectures on the criteria that move purchase price: string inverters (3-100 kW) sit at the low end, $0.10-$0.16/W, lowest per-watt BoM, simplest installation, 10-year standard warranty, and the widest service network. Central inverters (250 kW and up) push the lowest per-watt cost for utility-scale plants, with the lowest $/W inverter hardware and best $/W balance-of-system when paired with MV transformers, but they need DC combiner homeruns and dedicated MV pad. Microinverters (250-600 W module-level) land $0.20-$0.25/W, the highest per-watt, but module-level MPPT adds 2-5% energy harvest in shaded residential roofs and eliminates the string-level single-point-of-failure. Hybrid inverters (5-12 kW typical) cluster around $0.18-$0.24/W and bundle battery-grid-forming firmware, useful where storage is in scope [S4][S5][S6].
On a unit-price basis, U.S. solar PV inverter ASP rose from $1,900 in 2023 to a projected $3,000 by 2033, a trajectory that runs counter to per-watt declines because the mix is shifting toward higher-power residential string and hybrid units, not because BoM cost is rising [S5]. For buyers, this means raw $/W is a useful cross-vendor comparison only if you hold the architecture constant.
Total cost of ownership: where the inverter actually costs you money
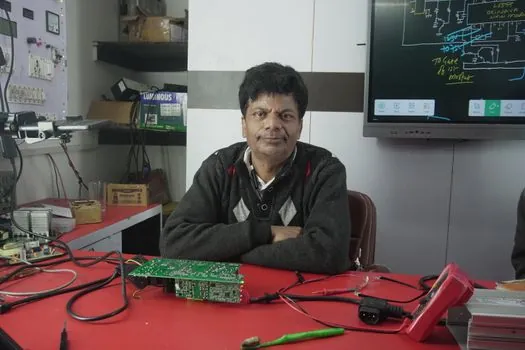
Hardware purchase is the smallest line on a 25-year inverter TCO. Replacement frequency is the larger number: a string inverter replaced once at year 12-15 on a residential system adds $1,000-$3,000 of new hardware plus $500-$2,000 of installer labor, on top of the original $1,000-$3,000 purchase, so a 25-year residential system commonly carries $2,500-$8,000 of cumulative inverter spend versus $20,000 of modules [S3][S7]. Commercial systems are louder: 2026 commercial replacement invoices run $5,000-$30,000 per swap depending on capacity, and a 25-year commercial plant with one mid-life swap is realistically in the $10,000-$60,000 inverter TCO range [S3].
Efficiency drag and downtime are the hidden columns. A 96.5% vs 98.5% CEC-weighted efficiency delta is 2% of lifetime energy yield, which at $0.12/kWh utility tariff on a 6 kW residential system is roughly $1,500-$2,000 over 25 years. Microinverter architectures avoid the string-level single-point-of-failure cost: a 2026 study of O&M tickets on residential portfolios puts mean time to first failure of central and large string units at 7-10 years versus 15+ years for module-level electronics, though per-event replacement cost is much lower on a microinverter [S3][S7]. Procurement specs that gate on efficiency, warranty term (10-year standard, optional 20-25 year extension), and arc-fault / rapid-shutdown compliance tend to deliver more TCO value than squeezing the last 2% off the BoM.
What moves the price in 2026 and which signals to watch
Three drivers dominate the 2026 inverter cost outlook. First, IGBT and SiC supply: SiC wafer capacity expansions through 2025-2026 are easing the per-amp premium, which over the next 12-18 months should pull 50-100 kW string BoM cost down 4-8% if vendors pass through. Second, the OBBBA tax-credit timing: commercial projects must begin construction by July 4, 2026 to lock the full 30% ITC under the new placed-in-service rules, which pulled demand forward and tightened inverter lead times in Q1-Q2 2026 [S3]. Third, grid-support firmware: IEEE 1547-2018 and UL 1741-SB certifications are now table stakes, and vendors that have not re-platformed carry an effective 3-5% cost penalty for retrofit compliance work.
Trackable signals: NLR's DCAM public tool for re-running cost stacks under different commodity and labor assumptions, the next SEIA Solar Market Insight quarterly for installed-price drift, and any updates to the IEEE 1547.1 test procedure that change certification cost. Buyers comparing two short-listed vendors should ask for a side-by-side BoM costed at the same IGBT spot price and labor rate, and should weigh a longer warranty more heavily than a 1-2% purchase-price gap. For the broader power-electronics context, see this procurement-side read on ball screw sourcing levers and this industrial gearbox TCO teardown, since the same BoM-plus-labor-plus-overhead stack applies to adjacent power-electronics assemblies.
For component-level specifications, see vfd, additive manufacturing material, and pressure transmitter.