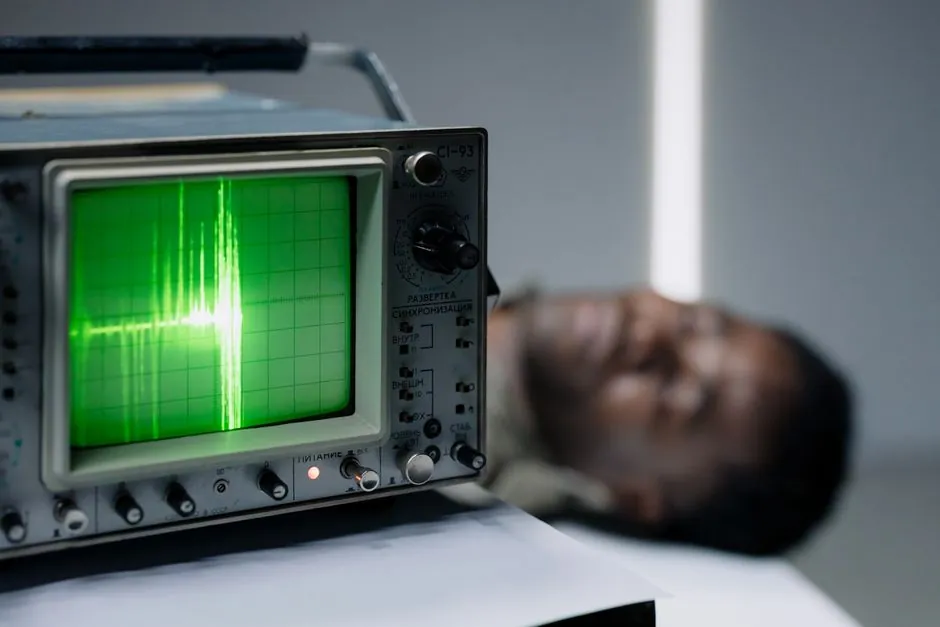
The two instruments answer different questions: a spectrum analyzer resolves frequency content of a signal (Welch or filter-bank methods, RBW in Hz) [S5], while a paperless temperature data logger such as the KH200R samples up to 16 thermocouple or RTD channels and exposes alarm, print, and RS-232/485 outputs for SCADA hand-off [S2].
Choosing the wrong one wastes budget: a spectrum analyzer is built for RF and baseband spectral density (dBm, dBW, Watts, spectrogram) [S5], not for sustained 1-second-or-slower thermal logging with limit-trip relays. Use a logger for process temperature limits; use a spectrum analyzer only if the temperature is encoded as a frequency on a wire.
What each instrument actually does
A spectrum analyzer, whether hardware like the R&S FSH handheld, R&S FPC bench, or R&S FSV [S4][S7][S8], or software-only like the MathWorks spectrumAnalyzer System object (available since R2022a) [S5], computes a frequency-domain view of a time-domain signal using FFT, Welch averaged periodograms, or filter-bank spectral estimation. Typical controls are center frequency, span, and resolution bandwidth (RBW), and the 3 Series MDO bundles a 1 GHz spectrum analyzer standard with optional 3 GHz upgrade behind an 11.6 inch HD touch display [S6].
A temperature data logger such as the KH200R accepts up to 16 universal inputs (thermocouple, RTD, standard V/mA) on a 160 by 80 mm bezel, archives to internal memory with year/month/day/hour/minute/second resolution, and serves RS-232/485 to KingView and MCGS configuration software [S2]. Alarm relays and transmitter loop-power output are built in, so the unit can both record and actuate on a setpoint.
Decision matrix: pick by signal type, not by name
Line the options against four decision criteria: signal type, sample cadence, output action, and integration. A spectrum analyzer (R&S FSH, R&S FPC, R&S FSV) is the right tool when (1) the signal is voltage at audio/RF, (2) you need sub-second sweep with RBW control, (3) the output is a measurement on screen or to a file, and (4) integration is a one-off bench or field-engineering task [S4][S7][S8]. A data logger like the KH200R is the right tool when (1) the signal is a thermocouple, RTD, or 4-20 mA process variable, (2) you need continuous seconds-to-days archival, (3) the output must trigger an alarm relay or feed SCADA, and (4) the device lives in a panel for years [S2].
Cost-of-error differs sharply. Specifying a spectrum analyzer for a reactor temperature limit means no alarm relay, no thermocouple input, and no audit trail in the format a process engineer or regulator expects. Specifying a data logger to chase a 10 kHz temperature-induced carrier means you will never see the spectral signature at all.
Where a spectrum analyzer is justified for "temperature"
There are two real cases. First, condition monitoring: a temperature sensor output modulates a carrier (for example, a resistance-temperature detector wired into a bridge excited by an AC source), and the engineer wants to see noise sidebands, mains pickup at 50/60 Hz, or thermal ripple riding on a DC bias. The MATLAB spectrumAnalyzer scope supports this directly: set SampleRate to your ADC rate, choose welch for low-variance estimates, and read dBm or dBW [S5]. Second, software-defined monitoring of a thermistor string read by a high-speed ADC, where the spectrogram view catches intermittent thermal events invisible in the time trace [S1][S5].
For the "paperless recorder" use case, however, none of these matter. You do not need an FFT, you do not need RBW, and you do not need a spectrogram. You need a bar graph, a real-time curve, a historical recall, an alarm status display, and a 16-channel universal input, which is precisely what the KH200R datasheet lists [S2].
Selection criteria for the temperature-limit logger
Match the spec to the loop, not to the brochure. For a multi-point reactor skin or bearing-temperature survey, confirm at least 8, preferably 16, universal inputs so thermocouple, RTD, 4-20 mA, and standard voltage can share one chassis [S2]. For hazardous-area points, follow the engineering guidance on thermocouple selection for hazardous-area temperature points, which addresses zone classification, sheath material, and approval marks separately from the recorder spec.
Verify three more data points before purchase: (1) sample interval and storage depth in days at full channel count, (2) alarm relay count and rating (form-C, 250 V AC typical for panel recorders), and (3) communication: RS-485 Modbus RTU is the practical floor for any new 2026 install because it survives long cable runs, and the KH200R's RS-232/485 port with KingView/MCGS support is a working baseline [S2]. For cost context across probe and instrument combinations, the thermocouple probe pricing 2026 reference breaks down the driver-side numbers.
How the two compare on operating envelope

A bench or handheld spectrum analyzer is rated for laboratory or field RF environments, with operating temperature typically 0 to 50 degrees C and DC-powered or line-powered operation; the R&S FSH and R&S FPC product lines target exactly that envelope [S4][S7]. A panel-mount data logger such as the KH200R is designed for continuous panel duty behind a 160 by 80 mm cutout, with thermocouple cold-junction compensation and universal input conditioning done on the same board [S2].
For a complementary comparison of point-of-measurement devices, the bimetal thermometer vs temperature transmitter decision map lays out response-time trade-offs that feed into the recorder's required sample rate. If the upstream sensor is a 4-20 mA transmitter on a compressed-air line, the pressure transmitter selection criteria reference covers the sensor side, leaving the logger to handle the archival and alarm role.
Limitations and failure modes
A spectrum analyzer used as a temperature logger fails on three counts: no universal thermocouple input (it expects V or dBm), no latching alarm relay, and no long-term CSV archive in the format a control room reads. Conversely, a data logger forced into a frequency-analysis role fails because its ADC sample rate (typically a few Hz) and fixed input conditioning cannot resolve audio or RF spectra, and it has no FFT or spectrogram display [S1][S5].
Interoperability note: HART is FSK superimposed on a 4-20 mA analog loop, and Foundation Fieldbus or PROFIBUS PA are fully digital protocols, so a generic "smart sensor" port does not automatically speak HART. Choose a logger whose Modbus map explicitly names each input type and engineering-unit range, and confirm the SCADA tag database, not the brochure.
Sourcing, standards, and what to verify on the datasheet

For the data logger, require a written specification of input types (TC types K/J/T/E/S/R/B/N, Pt100/Pt1000, 0-10 V, 0/4-20 mA), accuracy class (typically 0.2 percent of full scale for this class of recorder), isolation voltage between channels and to ground, and alarm-relay contact rating. The KH200R description explicitly lists universal input, alarm, loop-power output, printing, and RS-232/485 communication as standard features [S2], which is the minimum checklist for a 2026 panel-build.
For the spectrum analyzer, require a frequency-range statement, RBW and VBW ranges, phase noise in dBc/Hz at a stated offset, and DANL in dBm/Hz, all of which appear in the R&S FSH, R&S FPC, and R&S FSV specification documents [S4][S7][S8]. If the temperature signal is being analyzed in MATLAB or Simulink, anchor the algorithm choice to the documented Welch or filter-bank method and to the explicit dBm, dBW, or Watts display option [S5][S1].
The decision is a one-liner: for an audit-able, multi-channel, alarm-equipped temperature limit on a plant floor, spec a 16-channel universal-input paperless recorder with RS-485 and Modbus; for frequency-domain diagnostics on a temperature-modulated electrical signal, spec a spectrum analyzer with the RBW, phase noise, and DANL you can actually use, and keep the two roles separate.
Component reference pages worth checking: data logger, spectrum analyzer, and limit switch.