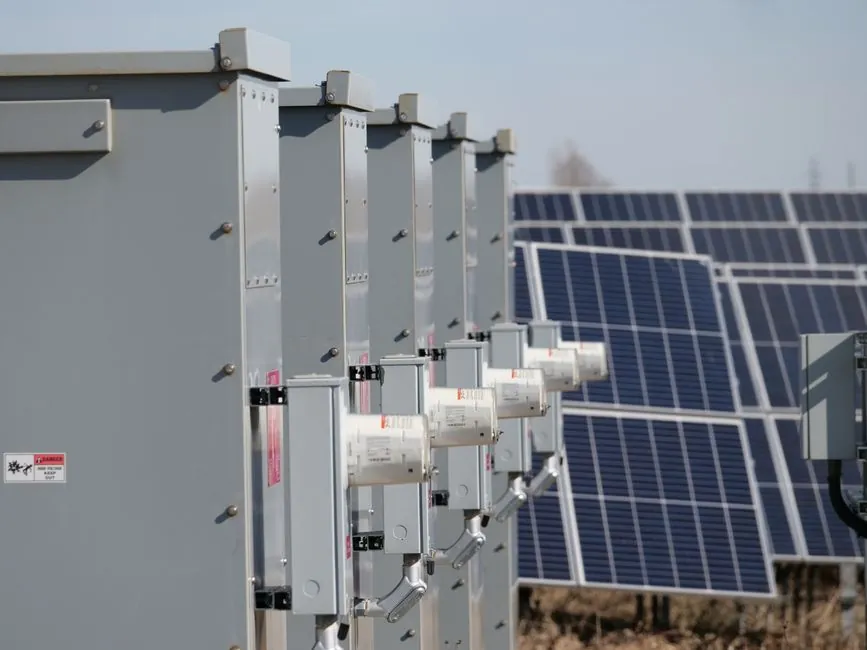
TOPCon cells combine an n-type phosphorus-doped wafer with a 1–2 nm tunnel oxide plus doped polysilicon rear contact, pushing commercial module efficiency to 22.2–23.0% and a temperature coefficient near -0.29%/°C [S1][S4]. In mass production TOPCon modules sit roughly 5–12% above PERC on a $/W basis, but the gap is narrowing as the same PERC lines are retrofitted with PECVD poly and oxidation steps [S1][S4].
The defining procurement question in 2026 is no longer "TOPCon or PERC" but "where does TOPCon actually pay back." First-year degradation is held to about 1% with annual degradation of roughly 0.4%, versus 0.5–0.55%/yr for typical Mono PERC, so the lifetime energy delta compounds fast in hot, high-irradiation zones [S3][S5]. Buyers sourcing solar cells from China should anchor the spec to IEC 61215 and IEC 61730 plus PVEL PQP scores before signing volume POs.
Cell Architecture: Why the 1–2 nm Tunnel Oxide Changes the Math
The rear stack on a TOPCon cell is a wet-chemically grown SiO₂ tunnel oxide (about 1–2 nm) capped by phosphorus-doped polycrystalline silicon deposited in PECVD and crystallised at roughly 900°C, with Al₂O₃/SiNₓ passivation and anti-reflective layers on top [S1]. This structure passivates the rear surface so aggressively that recombination losses fall well below a p-type PERC rear, and the n-type bulk avoids the boron-oxygen complexes that drive Light-Induced Degradation in PERC [S1][S3].
Operationally that translates into a bifaciality factor of 80–85% versus roughly 70% for PERC, a 0.30%/°C temperature coefficient against 0.40%/°C, and laboratory cell efficiencies above 25% with mass-production modules at 22.2–23.0% [S1][S3][S4]. The high bifaciality and lower thermal penalty are the two specifications a procurement engineer should write into the tender, because they directly drive $/MWh over the asset life.
Selection Criteria: LCOE, Irradiation, and Land Cost
Procurement is driven by Levelized Cost of Energy, not module $/W: a Rajasthan-style high-irradiation, high-ambient site shows 2–4% higher Capacity Utilisation Factor on TOPCon than on a comparable PERC plant, which routinely absorbs a 5–10% module CAPEX premium over 25 years [S3]. The same logic applies to any ground-mount project with high labour, racking, or land cost per MW, since higher module efficiency reduces panel count, racking tonnage, and DC cabling [S4].
PERC still earns its slot where land is cheap, climate is mild, and the developer is CAPEX-constrained, particularly on sub-100 kW commercial or residential rooftops [S4]. HJT (heterojunction) is a third lane: 22.5–23.5% module efficiency, near -0.24%/°C temperature coefficient, and 90% bifaciality, but at a 15–25% price premium over PERC and a short bankable-supplier list [S4]. A hybrid portfolio that pairs TOPCon on the high-irradiation tranches with PERC on the marginal land is now a documented field pattern, not a sign of indecision [S4].
Comparison Matrix: PERC vs TOPCon vs HJT on Six Decision Criteria
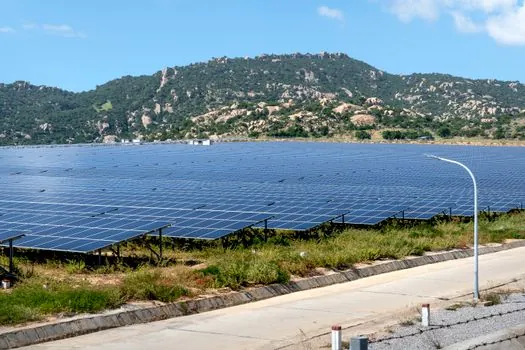
Across the three main cell architectures the trade-off surface looks like this: cell type (P-type mono vs N-type mono vs N-type mono), typical module efficiency (21.0–21.6% vs 22.2–23.0% vs 22.5–23.5%), temperature coefficient (~ -0.34%/°C vs ~ -0.29%/°C vs ~ -0.24%/°C), bifaciality (~70% vs ~80% vs ~90%), manufacturing maturity (very high vs high and scaling vs moderate, limited players), and relative price versus PERC (baseline vs +5–12% vs +15–25%) [S4]. The cell type difference matters operationally because linear guide compatibility for tracker rows, racking tolerances, and flow meter sizing for cleaning skids are all driven by the panel length and weight that follow from those efficiency tiers.
If a project is bid into a 2026 utility tender that scores lifecycle cost (SECI, NTPC, and several state DISCOMs already favour TOPCon on this basis), PERC's lower sticker price is offset by the 0.4%/yr degradation delta and worse temperature behaviour, and the LCOE gap swings back to TOPCon within roughly year 6–8 of operation [S3]. For a C&I rooftop on a 10-year payback horizon, the same math usually lands on PERC unless the roof is thermally constrained.
Bankability, Standards, and Warranty Discipline
Bankability is the filter that stops a great spec sheet from becoming a financed project. As of mid-2026 the technical-advisor database depth is: PERC, very deep across DNV, Black & Veatch, and Wood Mackenzie; TOPCon, broad but uneven, with leading Chinese Tier-1 names already in PVEL PQP and Kiwa/CSI lists; HJT, narrow, with only a handful of suppliers carrying multi-year field data [S4]. Module certifications to insist on are IEC 61215 (performance) and IEC 61730 (safety), with the manufacturer datasheet's 30-year linear performance warranty (87–89% output at year 30 for TOPCon, versus the standard 25-year PERC warranty) audited against real PQP scoresheets [S3][S4].
The procurement due-diligence checklist should therefore require: (1) the latest PVEL PQP or Kiwa PIT report for the exact TOPCon BOM, not the family name; (2) a 30-year linear performance warranty with explicit year-1 and year-2–30 degradation curves, not a single headline number; (3) a PID/LeTID test certificate under IEC 62804, since both modes are stronger in n-type; and (4) traceability of the tunnel-oxide and poly recipes because the same cell brand can run different rear stacks across fabs [S3][S4]. Skipping step (1) is the single most common reason a TOPCon PO ends up stuck in a bank's technical review.
Limits, Failure Modes, and Where TOPCon Underperforms
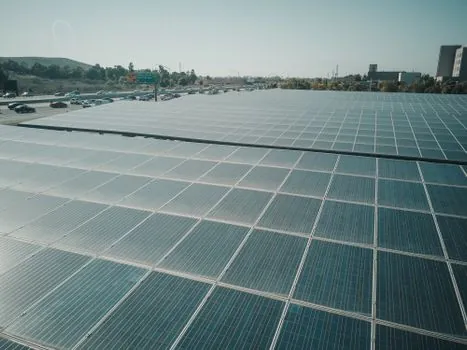
TOPCon is not a universal upgrade. In a sub-100 kW C&I rooftop where DC optimisers already clip peak string voltage and the roof has poor rear-side reflectivity, the 80–85% bifaciality advantage is wasted and the 5–12% module price premium carries no LCOE benefit [S4]. In freezing climates with low ambient temperature, the -0.29%/°C coefficient is never stressed, so a Mono PERC at -0.34%/°C gives up almost nothing over the asset life.
Manufacturing-side risk is the other real failure mode: tunnel-oxide uniformity and the 900°C anneal are tighter process windows than PERC's, and a poorly controlled poly deposition tanks fill factor and VoC. Tier-2 and Tier-3 fabs running on retrofitted PERC lines can ship 22.0% modules with year-1 degradation drifting past the 1% mark, which collapses the LCOE argument. The mitigation is exactly the same as the bankability step: hold the BOM to a PVEL-tested SKU from a fab with published field data, not just a familiar brand label [S3][S4].
Procurement Workflow: From Tender Spec to Signed PO
A clean 2026 TOPCon tender should be written around four numeric anchors: module efficiency ≥ 22.5%, bifaciality ≥ 80%, temperature coefficient ≤ -0.30%/°C, and year-1 degradation ≤ 1.0% with annual degradation ≤ 0.40% [S3][S4][S5]. Pair those with mandatory compliance to IEC 61215, IEC 61730, and IEC 62804 (PID), plus a 30-year linear performance warranty document, and a Tier-1 cell supplier with PVEL PQP or Kiwa PIT scoresheet reference, the field shortlist reduces from hundreds of SKUs to a manageable set [S3][S4].
Beyond the cells, the integration of crossed roller guide drives on single-axis trackers and load cell-based snow/wind load sensors on rooftop arrays both benefit from the lower weight-per-watt that high-efficiency TOPCon modules enable, which is a downstream BoS saving worth pricing into the LCOE model. The remaining watchpoints in the back half of 2026 are (a) HJT capacity ramp and whether Tier-1 HJT names clear the bankability gap, and (b) whether bifaciality-rated TOPCon modules from Tier-2 fabs start matching Tier-1 PVEL scores, which would pull the premium further toward zero and reset the cost ceiling for the next tender round [S4][S7].