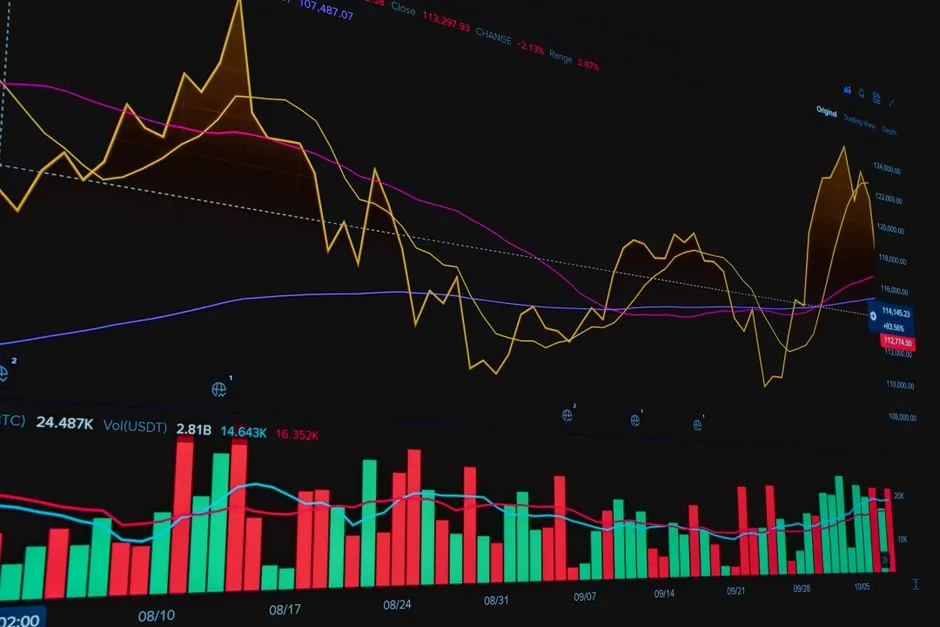
The global transformer market is projected to reach $83.80Bn by 2030 at a 5.70% CAGR over the 2024-2030 forecast window, with Asia-Pacific contributing the largest absolute volume [S1]. Underneath that headline number, the more binding story is on the supply side: lead times for large power transformers stretched through 2025 and remained tight entering 2026 [S4].
Demand-side, the IEA's Electricity 2026 outlook sees global electricity consumption growing at a 3.6% average annual rate across 2026-2030, with emerging economies accounting for nearly 80% of incremental consumption [S3][S5]. India alone is modelled at 6.4% annual electricity growth through 2030, a step-change above the global average [S5]. That spread is the single biggest variable behind regional transformer order books.
Market sizing: $83.80Bn at 5.70% CAGR to 2030
IndustryARC's forecast puts the global transformer market at $83.80Bn by 2030, implying a 5.70% CAGR from 2024 [S1]. The scope covers power, distribution, isolation, and instrument transformers, split across oil-immersed and dry-type insulation classes [S1]. The dry-type share is the segment to watch for data centres and indoor substations; oil-immersed still dominates utility transmission-class builds. For an insulation-class primer, see the dry-type transformer reference page.
By power rating, the segmentation breaks into low, medium, and high voltage classes, with the distribution (MV/LV) bucket carrying the largest unit count [S1]. By mounting, pad-mounted units lead urban and underground distribution, while pole-mounted units still dominate rural MV extension. By cooling, oil-cooled, self-cooled, and air-cooled options map roughly to rating size: oil for HV/MV transmission and large distribution, air-cooled for sub-1MVA dry-type indoor duty [S1].
Demand drivers: 3.6% global, 6.4% India, and data-centre load
IEA's Electricity 2026 base case has global power demand growing at a 3.6% CAGR across 2026-2030, with emerging markets supplying nearly 80% of the increment [S3][S5]. India's 6.4% annual growth sits almost 80% above that global average, driven by industrial electrification, cooling load, and renewables integration [S5]. China's grid build-out and India's "Power for All" capex are the two largest single-country contributors, with BHEL and Crompton Greaves named as domestic beneficiaries in the India expansion [S1].
A second driver that does not appear in headline CAGR numbers is data-centre load. Rystad's 2026 outlook flags power demand from data centres as a structural feature of the new electrified demand mix, even as oil and gas see supply-led price softness [S4]. For the transformer side, hyperscale data-centre builds translate into order demand for large pad-mounted distribution units, cast-resin dry-type units for indoor MV/LV rooms, and generator step-up transformers where on-site gas turbines are deployed. Selection context for adjacent spec work is in our line-frequency induction furnace selection piece where similar MV-class equipment gates apply.
Mix shift: distribution leads units, power leads revenue
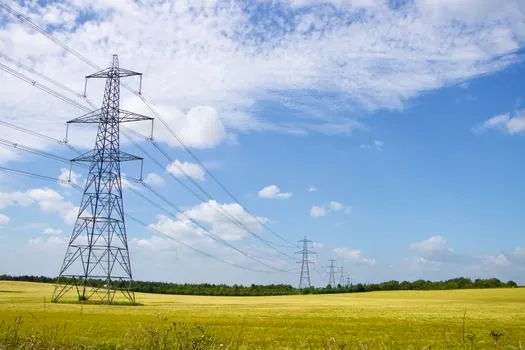
Distribution transformers carry the unit count, while power transformers carry the dollar value. IndustryARC's segmentation lists power, distribution, isolation, and instrument as separate product lines, and Schneider Electric's 2025 expansion of its EcoStruxure-ready distribution range is a direct read on where the smart-grid retrofit dollars are going [S1]. The mix is also tilting digital: Siemens Energy's IoT-equipped units with real-time monitoring and predictive maintenance are now an OEM catalogue line, not a research project [S1].
On the technology axis, the closed-vs-shell core segmentation matters less than the insulation choice for end users. Oil-immersed still wins on cost-per-MVA for outdoor HV/MV, while dry-type wins on indoor fire-safety, low maintenance, and reduced clearance. For the broader product context, see the power transformer reference.
Supply-side binding constraint, not a forecast risk
Transformer lead times were already a binding constraint entering 2026, not a marginal risk on the demand curve. Rystad's 2026 outlook calls transformer supply "tight" alongside its oil-and-gas predictions, and reports of capacity growth in adjacent energy equipment are running below the demand increment for the equipment class [S4]. The 2025 ERCOT peak-demand observation (the actual 2026 plan baseline was set on the 20 February 2025 hourly peak) is one concrete example of the kind of winter-peak numbers that drive MV-class distribution and substation transformer orders in North American utility cycles [S6].
Three things follow for procurement and engineering teams. First, secure long-lead slots (currently 12-24 months for HV power transformers) before finalising single-line diagrams. Second, standardise on a small number of OEM platforms to reduce qualification overhead; vendor consolidation is already visible (Schneider EcoStruxure, Siemens digital transformer lines) [S1]. Third, design the spec for the highest ambient and harmonic load you actually expect: data-centre inverter-driven harmonics derate standard distribution units faster than the nameplate suggests.
Selection criteria by use case
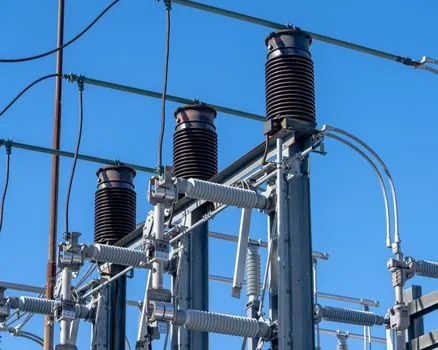
For utility transmission-class builds (HV, >100 MVA), the default is still oil-immersed with ONAN/ONAF cooling, with mineral oil or ester-fluid options dictated by fire and environmental rules. The selection gate is short-circuit withstand (typically 25-40 kA for 1-3 seconds, project-dependent) and BIL level. For industrial and data-centre distribution (1-10 MVA, MV/LV), dry-type cast-resin units dominate indoor substations; the gate is partial-discharge performance and floor-loading, not BIL. For commercial and residential LV distribution (<2.5 MVA), the decision is mostly between amorphous-metal cores (lower no-load loss, ~70-80% no-load loss reduction vs CRGO) and standard CRGO silicon-steel cores, with capex delta usually recovered in 3-7 years on high-load-factor sites. [S1]
Three other gates matter across the board: efficiency compliance (DOE 10 CFR 431 in the US, EU Tier 2 from Regulation 548/2014 for distribution units), harmonic derating (K-factor or K-factor-equivalent for non-linear loads), and the standards chain (IEC 60076 for power, IEEE C57 for North American utility, IEEE C57.12.01 for general dry-type). For an instrumentation-side adjacency, the pressure transmitter reference covers the kind of digital-sensor integration Siemens is putting on its smart-transformer busses.
Limitations, failure modes, and watch-outs
Failure modes cluster in three areas: thermal aging of paper-oil insulation (every 6-8 K hot-spot rise halves insulation life), bushing failures at HV ratings (partial discharge at the resin-oil interface), and load-tap-changer contact wear under high operations. For data-centre duty, harmonic heating in windings is the underrated killer; a unit perfectly sized for nameplate kVA can still run hot on the neutral because of triplen harmonics from rectifier loads. For outdoor utility duty, the failure mode is corrosion and seal aging on tank and radiators, plus wildlife incidents (squirrels, snakes) on pole-mounts. [S1]
Two caveats on the forecast itself. IndustryARC's 5.70% CAGR is a single-vendor model and should be triangulated against IEA electricity-growth data, which is more conservative at 3.6% globally but higher in India at 6.4% [S1][S3][S5]. The supply-tight call from Rystad is a 2026 outlook framing, not a multi-year forecast; the assumption that capacity keeps lagging is most exposed if HV transformer order books in Korea and Germany ramp into 2027 [S4].
Trackable signals into 2026-2028
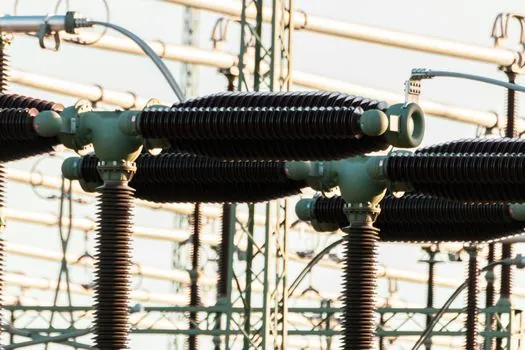
Three signals to watch. (1) India quarterly transformer-order disclosures from BHEL and Crompton Greaves; a sustained YoY run-rate at or above 15% on the distribution line would confirm the IEA 6.4% demand case is flowing into orders [S1][S5]. (2) ERCOT and MISO winter-peak actuals versus the 20 February 2025 baseline, which sets the 2026 planning reserve margin and directly drives substation transformer orders [S6]. (3) HV lead-time data from major US and EU utilities; any move below 12 months would suggest the supply bottleneck is easing, while 18 months or longer confirms the constraint binds through 2027 [S4].