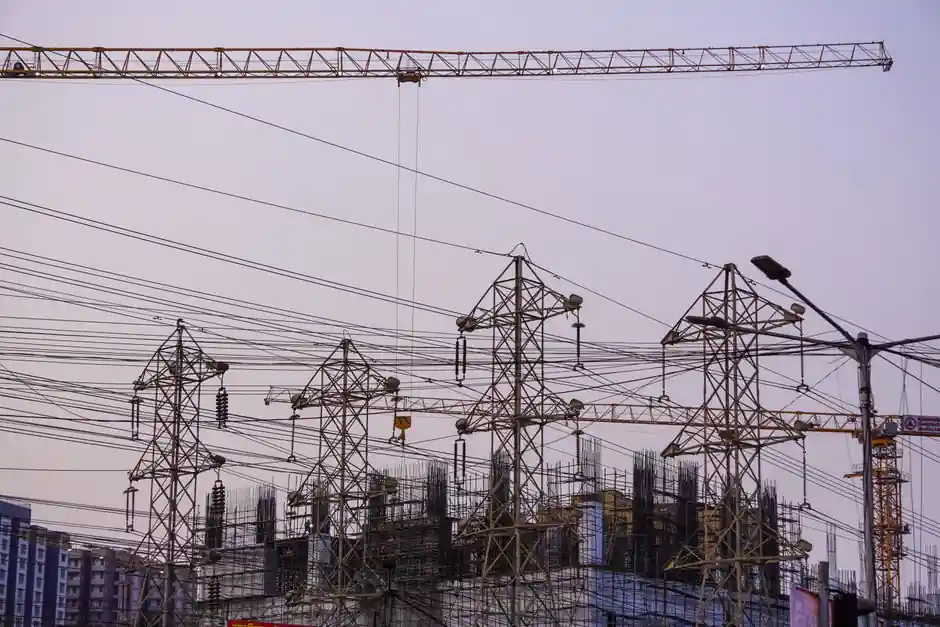
As of 2026, the United States sources roughly 80% of its large power transformers (LPTs) from foreign manufacturers, leaving a thin domestic base concentrated around a single grain-oriented electrical steel (GOES) producer and a shrinking number of integrated winding shops [S3][S5][S7].
The U.S. LPT market was valued at USD 1.16 billion in 2026 and is forecast to reach USD 1.48 billion by 2031 at a 5.07% CAGR, yet capacity expansion is bottlenecked by GOES supply, skilled-labor availability, and 36–48 month global lead times [S2][S3]. See the power transformer reference page for baseline specifications and voltage-class definitions.
Import Dependence and the Structural Exposure
Multiple sources converge on a 79–82% U.S. Import share for LPTs in 2025–2026 was approximately 80% in 2025, with one source citing 82% [S6][S7]. Mordor Intelligence places the dependence at 80% and pairs the figure with a stretched lead-time window of up to 210 weeks for some configurations [S3].
This exposure is not symmetrical. Imported LPTs and their subassemblies (transformer bushings, on-load tap changers, and winding copper) are exposed to tariff escalation, ocean-freight disruption, and currency shifts, while domestic alternatives command a structural premium for grid-critical delivery reliability [S1][S2]. Industrial buyers accustomed to treating power transformer selection as a commodity spec exercise are now forced into multi-year procurement contracts and longer design freezes.
Domestic Winding and Steel Bottlenecks
Cleveland-Cliffs remains the only domestic producer of grain-oriented electrical steel, the engineered core material with grain-aligned magnetic domains that determines transformer no-load loss; it operates plants in Pennsylvania and Ohio, and every U.S. transformer manufacturer drawing on domestic GOES is effectively a single-source customer [S5].
Winding capacity is constrained by parallel issues: copper prices have held between USD 8,500–10,500 per ton, GOES prices have roughly doubled since 2020, and manufacturers including Hitachi Energy, Siemens Energy, and GE Vernova have announced multi-billion-dollar capacity expansions that will take years to commission [S2]. A National Laboratory of the Rockies report documents that increased tariff rates on LPTs and their components will likely raise delivered costs and lengthen the qualification cycle for replacement domestic suppliers [S1].
Lead Times, Prices, and Demand Growth
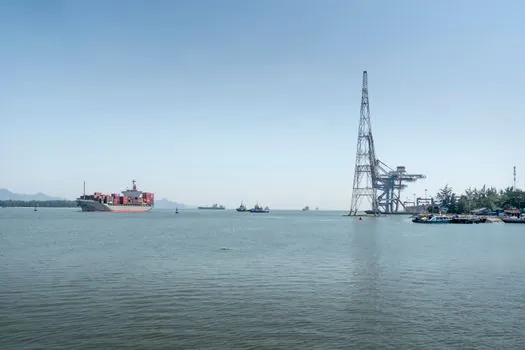
Wood Mackenzie's Q2 2025 survey shows standard power transformer lead times averaging 128 weeks and generator step-up (GSU) units averaging 144 weeks, with some orders extending to four years [S5]. Global LPT lead times are now 36–48 months, up from 12–18 months before 2020, and distribution transformer backlogs run 12–24 months [S2].
Demand has surged since 2019: GSU demand is up 274%, power transformer demand up 119%, and global demand is 25%–40% above pre-2020 levels while manufacturing capacity has expanded only 10%–15% [S2][S5]. U.S. power transformer prices are up 77% since 2019, distribution units up 78%–95%, and average LPT unit costs have risen 60%–70% since 2020 [S3][S5].
Cooling-Type and End-Use Composition
By cooling medium, oil-immersed units held 83.05% of the U.S. LPT market in 2025 because mineral-oil cooling handles 100+ MVA thermal loads more economically than air; air-cooled designs are projected to grow at a 6.46% CAGR through 2031 as fire-safe ester fluids and dry-type designs gain urban substation share [S3].
By phase, three-phase configurations led with 87.02% revenue share in 2025 and are forecast at a 5.56% CAGR, while end-use splits put power utilities at 57.55% with industrial applications advancing at 6.05% CAGR through 2031 [S3]. The 100 MVA global segment is projected at USD 1,092.88 million in 2026 [S4]. Utilities are responding with multi-year procurement agreements, ester-fluid retrofills, and digital monitoring retrofits to extend asset life and meet evolving cybersecurity requirements [S3].
Grid Demand Drivers and Funding Pull
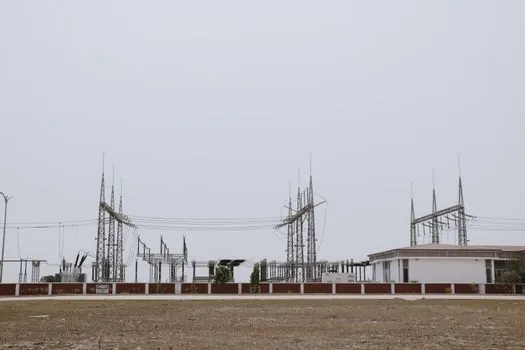
Mordor's driver-impact analysis adds 1.8% CAGR from federal grid-modernization funding, 1.5% from utility-scale renewable inter-tie demand, 1.2% from aging fleet replacement, 0.9% from hyperscale data-center clusters, and 0.7% from rail-corridor electrification projects [S3]. See the Power Transformer Demand Outpaces Capacity Through 2026 brief for the parallel demand-side picture.
Grid resilience spending, hyperscaler build-outs in Virginia, Texas, Ohio, and Oregon, and the 70%+ share of U.S. LPTs now over 25 years old are stacking on the same supplier base [S2][S3]. The global power transformer market is projected to reach USD 46.4 billion by 2033 at a 7.4% CAGR over 2026–2033, which keeps the U.S. import pipeline full and raises questions about which utilities will hold priority slots in the constrained order book [S8].
Decision Criteria for Specifying Against This Market
Specifying engineers should weigh four criteria: domestic content vs. lead time, voltage class vs. available supplier pool, cooling medium vs. site fire load, and standardization vs. customization. For 230 kV+ GSU units in the 100–500 MVA class, domestic lead time of 128+ weeks versus imported 36–48 months is a wash; the binding constraint is the GOES slot at Cleveland-Cliffs, which gates all domestic output [S2][S5].
For substations in dense urban areas, ester-based insulating fluids reduce fire load but trade off against lower thermal rating versus mineral oil, requiring a larger transformer footprint for the same MVA. Standardized pad-mounted designs draw on a deeper domestic distribution-transformer backlog (12–24 months globally) but limited U.S. LPT production means custom impedance, noise, and BIL specs still route to imports. Practically, most U.S. utilities now lock procurement 3+ years ahead and accept either a domestic premium or an import-sourced unit with extended commissioning risk.
Constraints, Failure Modes, and What Buyers Are Watching
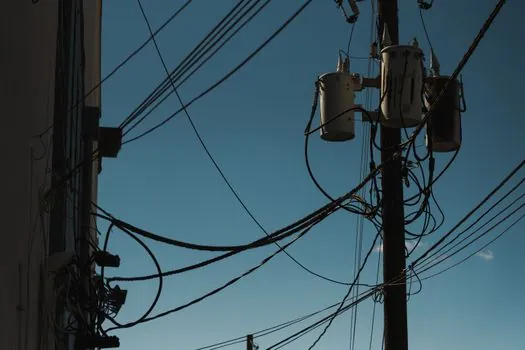
The binding constraints are not financial but material and human: GOES line capacity at a single domestic producer, copper supply at 8,500–10,500 USD/ton, and a skilled winder/impregnator workforce that cannot be trained in a single fiscal year [S2][S5]. More than USD 1.8 billion in announced capacity expansions is in flight, but ramp-up hurdles in skilled labor and GOES temper near-term relief [S3].
Failure modes already visible in the field include: extended energization delays shifting project IRR, transformer overloading on a 25+ year-old fleet during heat events, and forced acceptance of non-OEM spare bushings or tap changers that compromise type-test compatibility. Two trackable signals to watch through the next four quarters: (1) Cleveland-Cliffs GOES output and qualification of any second domestic source, and (2) the realized commissioning dates for the announced Hitachi Energy, Siemens Energy, and GE Vernova capacity expansions.
Spec-level background on the components involved: checking and testing apparatus, and construction machinery and equipment.