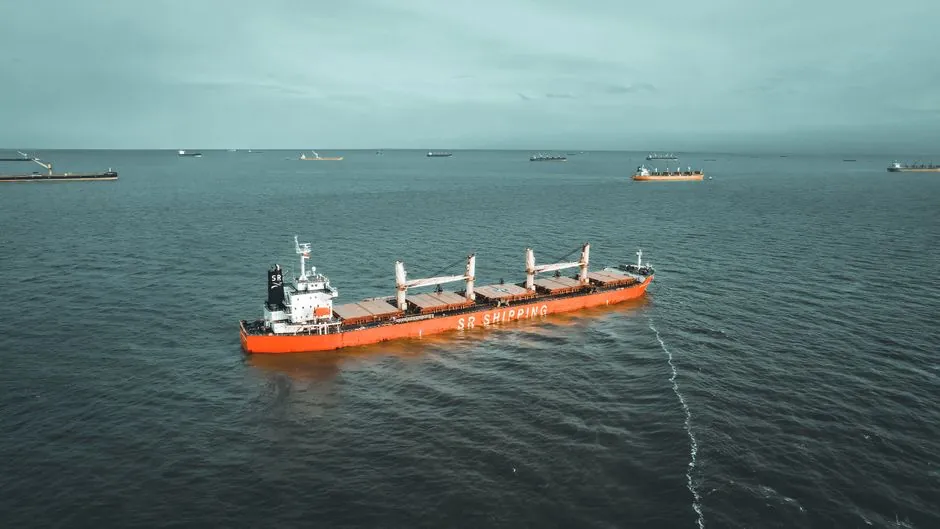
Net US cement and clinker imports hit 27 million short tons in 2025, accounting for 24% of 2025 shipments, up from 7% in 2012 as domestic kiln capacity additions have lagged consumption growth [S4].
The US, UK, Kenya, and the EU27 all face the same structural gap: grinding capacity has expanded faster than kiln capacity, forcing mills to import clinker from Turkey, Vietnam, North Africa, and the Middle East [S3][S5][S7].
US import math: 24% of supply, 1.5% annual growth, 11% clinker surge
The US produced 114.1 million short tons of portland, blended, and masonry cement in 2025, down 2% from 2024 and 18% below the 2005 peak of roughly 140 million tons [S4]. Net imports of 27 million short tons covered the gap, with clinker contributing the marginal swing: imports of clinker rose 11% in 2025 because domestic kiln capacity could not satisfy grinding demand [S9]. The EPA NESHAP 2010 emissions rule forced the retirement of older wet and long-dry kilns, and OPC-to-Type IL conversions added only 10-15% capacity at converted plants, not net new clinker tonnes [S4].
Texas alone consumed 18% of US cement in 2025, making Houston-Galveston the single largest import district. Independent importers handling material at Houston-Galveston, Miami, New Orleans, Philadelphia, Savannah, and Tampa are not captured in USGS surveys, so published import figures understate actual inbound tonnage [S2]. For related background on how carbon-border levies interact with imported clinker, see CBAM steel and aluminium cost impact: 2026 regime and 2030 numbers.
UK: one-third of cement imported, non-EU share jumps to 18.6%
The UK produced roughly 7.3 million tonnes of cement in 2024, the lowest level since the 1950s and about half the 1990 output, according to written evidence Cemex submitted to Parliament in March 2026 [S5]. HMRC trade data compiled by the Mineral Products Association shows total UK cement imports slipped from 3.47 Mt in 2024 to 3.21 Mt in 2025, but the origin mix shifted sharply: EU-origin cement fell from 3.23 Mt to 2.61 Mt while non-EU imports climbed to 596,000 t (18.6% of total) from 236,000 t in 2024 [S5].
UK clinker imports from the EU alone totalled 289,000 t in 2025, up on 2024 and back near the recent five-year average [S5]. Cemex warned Parliament that "almost one third of cement used in the UK is now imported, increasing the exposure of the construction sector to international supply chain risks, geopolitical developments and volatile global markets" [S5]. Turkish, Vietnamese, North African, and Mediterranean producers are filling the EU-supply gap, and these plants "operate under weaker environmental, health and safety and regulatory standards, and produce significantly more carbon-intensive products" than UK kilns, per the same submission [S5]. For context on how buyer carbon data requests are now reaching mid-tier building-products suppliers, see Supplier Carbon Data Requests: How Buyer Pressure Hits Mid-Tier Manufacturers.
Kenya: 20-35% clinker import dependence, USD 55-85/t landed cost
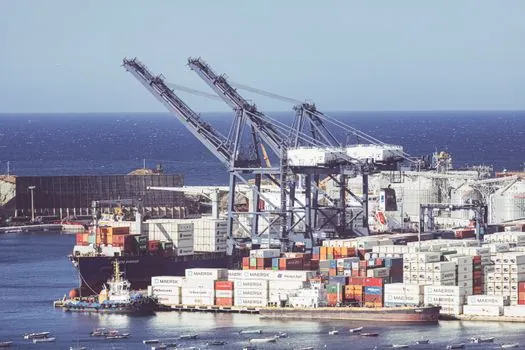
Imported clinker covers an estimated 20-35% of Kenya's clinker needs, with regional and Middle Eastern suppliers dominating seaborne volumes; IndexBox projects this dependence could compress to 15-25% by the early 2030s as new domestic kilns come online [S3]. Landed clinker prices in Kenya run USD 55-85 per tonne, with energy and transport the dominant swing factors: thermal energy alone represents 40-55% of clinker production cost, and Mombasa port congestion plus weak inland rail and road links add 15-25% to delivered price [S3].
Kenyan domestic clinker volumes are projected to grow at 5-7% annually through 2035, anchored by infrastructure spending, urbanization, and housing demand, but the cement grinding fleet is already larger than the kiln fleet, so the structural import requirement persists even with new capacity [S3]. East African Community cross-border flows from Tanzania and Uganda complement seaborne imports and give Kenyan grinders a more diversified procurement mix than the seaborne-only model that dominated a decade ago. For the equipment side, projects that import clinker to feed grinding-only plants depend on reliable power supply and DC power supply for mill drives and PLC panels, since a single voltage dip can stall a 10,000 tpd grinding line.
EU27 and seaborne clinker: Eurostat flows and price transparency
Cement Europe's May 2026 Key Facts & Figures publication tracks EU27 border cement and clinker imports and exports through Eurostat data, with volumes reported in millions of tonnes [S7]. European buyers increased reliance on non-EU clinker through 2025 as domestic decarbonisation capex idled capacity, and the May 2026 release documents both the volume shift and the CO2 intensity gap between EU and imported clinker [S7]. GTAIC's March 2026 review of the top-24 European clinker-importing countries puts aggregate 2026 imports at 0.06 BN USD and 646.48 kt through the latest available window, with one country cluster accounting for 39,023 t of import change [S6].
S&P Global's June 2026 note on price transparency flags Middle East conflict as the dominant short-term swing factor for seaborne clinker: "Heightened tensions and conflict in the Middle East can lead to unpredictable cement and clinker prices due to supply chain disruptions" [S1]. The combination of Red Sea routing risk, Turkish lira volatility, and Egyptian export quotas means a single tender can move FOB Med clinker by USD 8-12/t inside a quarter, which then propagates into delivered US Gulf, UK, and Kenyan prices within 30-45 days. Switching power supply units inside cement plant control rooms are now being specified with wider input ranges (typically 85-305 VAC) to ride out grid instability on seaborne-route import days when multiple plants restart at once.
Clinker vs cement: what the import numbers actually count
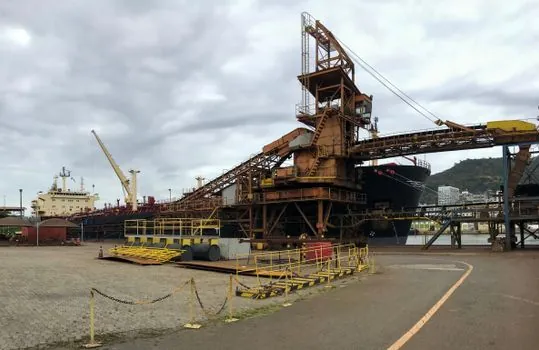
USGS counts combined cement and clinker imports at the customs district; for January 2026 the 1.80 Mt total includes both finished cement (Type I, Type IL, masonry) and grey or white clinker shipped to grinding plants [S2]. In 2024, 574,000 t of US clinker imports came from Canada across the Great Lakes, with 806,000 t arriving by ship from Turkey, Mexico, Colombia, and other origins, per PEC Consulting's grinding-plant study [S8]. That split matters because lake-borne clinker from Canada is a 5-7 day transit with low carbon intensity, while seaborne clinker from Turkey carries the full shipping emission load and lands at 2-3x the unit cost once insurance, demurrage, and CBAM exposure are added [S8].
The 2010 NESHAP rule's emissions cap, the 2022-2023 OPC-to-Type IL conversions that add 10-15% capacity per converted kiln, and the lack of greenfield kiln permits in the US since 2018 all explain why grinding capacity has outrun clinker capacity and why the 24% import ratio is sticky rather than cyclical [S4]. US annual cement shipments grew at a CAGR of 1.0% from 2015 to 2025 (103.1 Mt to 114.1 Mt), so even a slow-growth demand environment cannot be met without imports, because domestic kiln output is structurally capped [S4]. Lighting equipment and electric lamps inside covered clinker storage domes are typically specified to IP65 with 50,000-hour LED life, since maintenance access in a live grinding hall is a 2-3 day permit cycle.
What to watch through Q4 2026
Two signals will tell you whether the import-dependence story softens or deepens by year-end: the USGS April 2027 annual survey (covering full-year 2026) will update the 24% import ratio and the 11% clinker-import growth figure, and Cement Europe's next Eurostat pull will show whether EU27 net imports stay at 2025 levels or accelerate as CBAM reporting tightens [S4][S7]. A third trackable number is Kenyan domestic kiln output: if the 5-7% annual growth IndexBox projects materialises, imported clinker share should compress from 20-35% toward 20-25% by mid-2027 [S3]. Until at least one of those numbers moves, expect import dependence to stay the binding constraint on US, UK, and EU cement supply planning.
