
Decommissioned wind blade volumes are running 3,000 to 9,000 units per year through 2026 and are projected to climb to 10,000 to 20,000 annually by 2040, with the U.S. and Europe absorbing the first wave of first-generation 20 to 25 year assets [S7].
Recycling routes now split into mechanical shredding, thermal pyrolysis, and chemical solvolysis, with a small rare-earth sidestream pulled from generators; commercial plants are clustered in Iowa, Denmark, the UK, and France, and they all face the same $1,000 to $2,000 per ton processing cost against a $60 to $150 per ton landfill benchmark [S4].
Market sizing: three different curves, same direction
Forecasters published in 2026 disagree on absolute size but agree on trajectory. Coherent Market Insights values the 2026 market at USD 68,125.1 thousand and projects USD 636,262.3 thousand by 2033 at a 37.8% CAGR [S3]. Straits Research frames the base at USD 97.05 million in 2026, growing to USD 396.87 million by 2034 at 19.25% CAGR [S6]. Fortune Business Insights pegs 2025 at USD 97,533.18 thousand and projects USD 137,405.06 thousand the following year [S1]. BCC Research's 2026 publication Global Wind Turbine Blade Recycling Market (ENV075A) sets the runway from USD 64.96 billion in 2024 to USD 158.9 billion by 2030 at 16.6% CAGR [S2].
The wide spread reflects whether the model counts only end-of-life blade processing fees or also includes downstream recovered material revenue streams in cement co-processing, construction aggregates, and re-spun fibers. Process engineers reading these numbers should treat the low-end curves as service-revenue reality and the high-end curves as material-recovery potential. For procurement teams sizing long-term feedstock contracts, the conservative 19.25% CAGR from Straits Research is the most defensible anchor for a 7-year capacity plan [S6].
Process routes compared: mechanical, thermal, chemical, and the magnet sidestream
Coherent Market Insights puts physical recycling at 38.8% of 2026 share, the largest single process bucket, because shredding, grinding, and milling need the lowest capex and avoid high-temperature reactors [S3]. Thermal pyrolysis follows, used by DecomBlades in Denmark for material-passport-tracked output, while chemical solvolysis and fluidized-bed recovery are still pilot-scale in 2026 [S4]. Fairmat runs a low-temperature mechanical route in Paris producing carbon-composite sheets for automotive and aerospace; REGEN Fiber runs a mechanical line in Fairfax, Iowa, rated at 30,000 tons of blades per year, the first commercial-scale mechanical plant in the U.S. [S4].
Glass fiber dominates the input stream, projected at 45.3% of 2026 share because it has been the standard blade reinforcement since the 1990s, and Vestas has publicly anchored its circular program around glass-fiber recovery with partners Olin and Stena Recycling [S3]. The high-value exit stream sits elsewhere: a single 3 MW turbine contains rare-earth magnets worth more than the entire blade composite, and Cyclic Materials has raised USD 162 million across three rounds to run its MagCycle mechanical separation and REEPure hydrometallurgical refining on those magnets, with T. Rowe Price leading the USD 75 million round in May 2025 [S4].
Selection logic for a recycler or a wind-farm asset manager: pick mechanical shredding when the output goes to cement kilns, construction aggregate, or low-grade thermoplastic pellet, pick thermal pyrolysis when recovered fiber length matters, pick chemical solvolysis only when virgin-grade carbon fiber commands a premium end buyer, and always run the generator magnets through a rare-earth line separately because that stream carries the highest unit margin [S3][S4].
End markets and what the recovered material actually sells for

Coherent Market Insights attributes 29.7% of 2026 demand to construction materials, the largest end-market bucket, reflecting cement-kiln co-processing by Veolia and aggregate substitution in concrete products [S3][S2]. BCC Research's 2026 publication highlights recovered composite demand across construction, automotive, and electronics, with Veolia, Holcim, Vestas, Siemens Gamesa, REGEN Fiber, Carbon Rivers, and Fairmat named as key players [S2]. REGEN Fiber converts shredded output into thermoplastic pellets, decking boards, and parking bollards, the kind of low-spec but high-volume product that justifies a 30,000 ton per year mechanical line [S4].
Fairmat's infinitely recyclable carbon-composite sheets target automotive and aerospace tiers where mechanical property retention matters more than cost per ton, and Uplift360, based in Bristol and backed by the NATO Innovation Fund at EUR 8.5 million, focuses on virgin-quality carbon fiber and aramid recovery from aerospace and wind composites [S4]. The downstream revenue stack is therefore bimodal: bulk tonnage at low margin for cement and aggregate, and small tonnage at high margin for recovered fiber and rare-earth oxides. Both streams are needed because the high-margin stream alone cannot absorb the 4 million tons per year of blade waste projected by 2050 [S4].
Regional mix: Europe leads volume, Asia Pacific leads growth
Coherent Market Insights puts Asia Pacific at 38.2% of 2026 share as the leading region, with Europe at 24.5% as the fastest-growing market [S3]. BCC Research's May 2026 release flips the framing: Europe holds 50.7% of share, reflecting its earlier wind build-out and the first wave of European retirements [S2]. Both can be true at once: Europe is where the retired blades are physically located today, while Asia Pacific is where new build-out and onshore retirement queues are densest, and the construction-materials downstream demand is strongest in China's cement sector. For anyone sizing transcontinental feedstock logistics, the practical read is that European mechanical plants will run near capacity through 2030 while U.S. and Asian capacity is still being commissioned [S3][S4].
Cost gap, regulation, and the landfill shadow
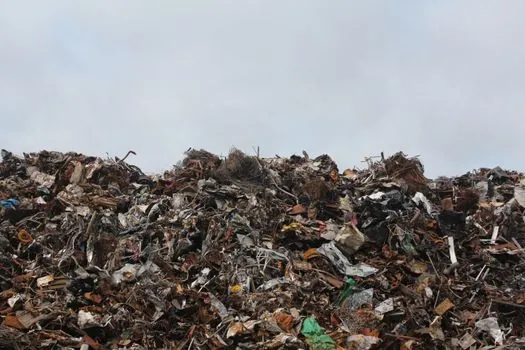
Recycling costs run 10 to 20 times landfilling in 2026, a structural gap that explains why most blades still go to landfill despite headline announcements, and why Global Fiberglass Solutions, which had a contract to recycle blades for GE, abandoned thousands of tons in Texas and now faces criminal charges [S4]. The U.S. Department of Energy responded with USD 20 million in funding aimed at closing the cost gap, and the European landfill-ban trajectory continues to push volumes toward mechanical and thermal processors [S4][S2].
AI-based sorting entered the picture in 2025 to 2026, applied to blade composite identification and separation; the wider industry context is that 72.2 GW of new wind capacity was added in the first half of 2025, a 64% year-on-year increase, which locks in another retirement wave two decades out [S5]. Sorting automation is one of the few levers that can move the per-ton processing cost toward the landfill benchmark, because manual dismantling and identification is a major share of the current $1,000 to $2,000 per ton number [S4][S5].
What the 2026 numbers mean for spec and procurement
A spec or sourcing engineer working on blade retirement planning in 2026 should anchor three numbers: a retirement rate of 3,000 to 9,000 blades per year today, rising to 10,000 to 20,000 by 2040; a processing cost band of $1,000 to $2,000 per ton against a $60 to $150 per ton landfill alternative; and a glass-fiber share of 45.3% of the input stream, which means any new recycling line that cannot process glass-fiber-dominant blades is missing the volume market [S7][S4][S3]. The procurement reality is that landfill disposal remains the default for cost reasons, and the policy and funding signals in 2026 (USD 20 million from the U.S. DOE, European landfill restrictions, and AI sorting pilots) are the variables most likely to shift the cost curve in the next 24 to 36 months [S4][S5][S2].
For composite-material buyers, the practical question is not whether recycled blade material exists in 2026, it does, but whether the recovered fiber specifications (length, surface treatment, residual contamination) match the buyer's forming process; the published commercial lines in 2026 deliver pellets, decking boards, and parking bollards rather than structural re-spun yarn, and that gap defines the realistic end-market today [S4]. Engineers sizing BESS container hardware for a wind site, where structural and enclosures overlap with composite recovery, can read more in BESS container lead time breakdowns, while those tracking AI-driven sorting of composites can cross-reference CE marking documentation for machine builders for how the same automation wave is hitting industrial equipment compliance.
Spec-level background on the components involved: pressure transmitter, flow meter, and industrial valve.