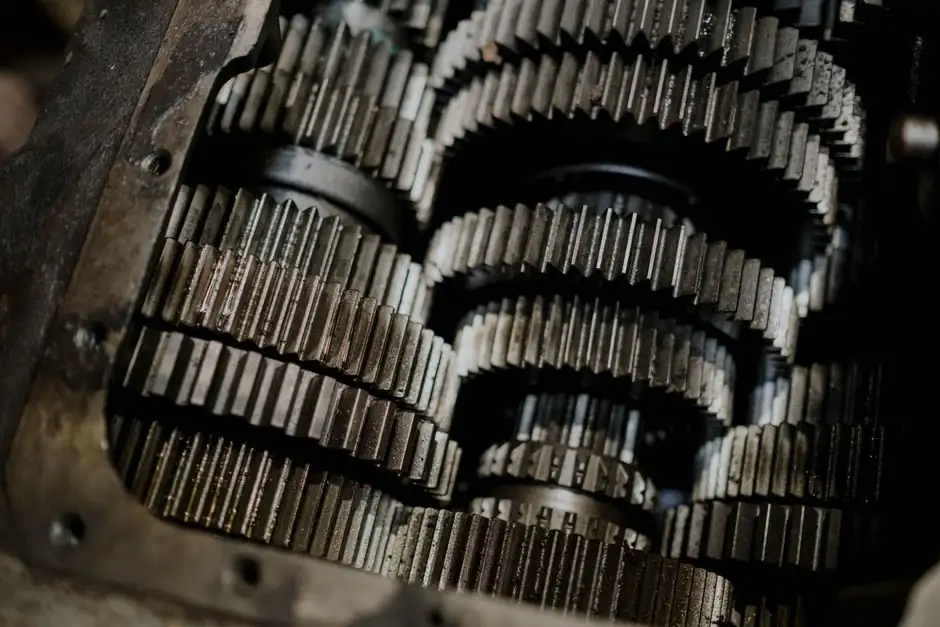
A utility-scale wind turbine gearbox accounts for roughly 8 to 10 percent of total construction and installation cost, with the most expensive sub-assemblies being the planetary stage(s), the ring gear, and the high-speed-shaft bearings [S6].
Harzendorf et al. (2018) at RWTH Aachen built a modular cost-estimation model for wind turbine drivetrains validated against a 5 MW benchmark, and showed that material and machining cost together dominate the gearbox bill of materials, while heat treatment, grinding, and assembly each add single-digit percentage points [S1]. The same line of work, supplemented by industry interviews, found that drivetrain architecture (number of planetary stages, medium-speed vs. high-speed, torque density) can swing total gearbox cost by 20 to 35 percent at equal rated power [S1].
What a Wind Turbine Gearbox Actually Costs Inside the Turbine
In a generic onshore wind turbine CAPEX breakdown, the gearbox, generator, and power converter together represent about 18 percent of turbine cost; the gearbox alone sits near the lower end of that combined figure, with the split between gearbox and generator shifting toward larger generators on direct-drive machines [S3]. Historical drivetrain analyses place the gearbox at roughly 8 to 10 percent of total construction cost for a geared utility-scale machine, while replacement events (crane, crew, downtime) can each reach multiples of the original gearbox purchase price once logistics are tallied [S6]. The market for these units was valued at USD 7.47 billion in 2025 and is projected to reach USD 13.53 billion by 2034 at a 6.8 percent CAGR, driven by offshore expansion and turbines above 15 MW [S4].
A separate forecast puts the same market at USD 17.73 billion by 2035 at a 4.57 percent CAGR, reflecting different baseline assumptions on offshore build-out and service-replacement volumes [S7]. The 1.5 to 3 MW capacity-rated segment remains the workhorse for onshore Asia Pacific, which captured 42.1 percent of 2025 gearbox revenue, with China alone at 24.3 percent of global demand [S4].
Cost Drivers Inside the Factory: Materials, Machining, Heat Treatment
Harzendorf's 2018 drivetrain-cost model identifies the gear-blank material (typically low-alloy case-hardening steels such as 16MnCr5, 17CrNiMo6, or 18CrNiMo7-6) plus case-hardening and grinding as the largest contributors to part cost, with bearings and housing castings second [S1]. The same study benchmarks a 5 MW reference turbine and validates the model to within a few percentage points of expert estimates, confirming that the rough order of magnitude is: material 35 to 45 percent, machining and gear cutting 20 to 30 percent, heat treatment (carburising, induction, nitriding) 8 to 12 percent, grinding and finishing 5 to 10 percent, assembly and testing 5 to 8 percent, with the remainder in QA, NDT, and overhead [S1].
Bearings and high-speed-shaft sub-assemblies are the second cost peak because they are the most precision-ground components in the box and they determine the gearbox's achievable torque density. A practical engineering rule: switching a planetary stage's carrier from a cast iron casting to a forged or welded steel structure typically raises piece cost 10 to 20 percent but extends fatigue life and reduces unplanned-replacement probability, which is what most fleet operators actually care about [S3]. For context, planetary, helical, bevel, spur, and worm configurations are all in service; helical units held a 38.2 percent share of the 2025 gearbox market by type, with planetary stages dominant in multi-MW turbines [S4].
Comparison of Drivetrain Architectures on Cost

The 2018 RWTH Aachen case study compared two 5 MW-plus gearbox solutions on equal power and found the more torque-dense, lower-stage design reduced part count and total weight by roughly 20 to 25 percent, but required larger gears and more expensive bearings, leaving net manufacturing cost similar within 5 percent [S1]. Against a direct-drive generator, the geared solution carries higher mechanical complexity and warranty exposure but lower generator and converter cost; OEM warranty contingencies are documented to inflate geared turbine sales prices meaningfully because gearbox reliability historically lagged the rest of the drivetrain [S8].
Three architectures compared on four decision criteria:
1. Geared multi-stage (planetary + helical): lowest generator cost; moderate gearbox cost; medium O&M exposure; suited to 1.5 to 8 MW onshore and most offshore [S3][S4].
2. Medium-speed (1-2 planetary stages, permanent-magnet generator at ~100 to 400 rpm): higher generator cost; lower gearbox cost per kW; low O&M exposure; preferred for offshore above 8 MW [S1][S4].
3. Direct-drive (no gearbox): highest generator and converter cost; zero gearbox cost; lowest mechanical O&M; higher permanent-magnet material exposure [S3].
The "right" answer depends on rated power, offshore vs. onshore logistics, and operator discount rate, not on the gearbox itself in isolation [S3].
Total Cost of Ownership: Why Gearbox Cost is Not Gearbox Price
Gearbox purchase price is the smallest line in 20 to 25 year lifetime cost; crane, vessel, crew, and lost production during a single replacement can exceed the gearbox part cost on offshore machines [S5][S6]. Midwest Power Products (2026) frames this as the dominant O&M variable: long replacement lead times, repair complexity, and unplanned-crew mobilisation drive most of the O&M budget variance, with poor gearbox reliability pushing inspection frequency and parts inventory up across the fleet [S2]. Harzendorf et al. note that innovation in the drivetrain is judged not on first cost but on lifetime cost, which is why manufacturing-cost models for new concepts must be paired with reliability and maintainability assumptions from day one [S1].
A practical TCO rule of thumb: each avoided unplanned gearbox replacement event saves 3 to 10 times the gearbox's purchase price once lost revenue, vessel, and crew are included, with offshore ratios at the upper end [S5][S6]. See the engineering reference for gearbox topology and standards for the background on stage-count and ratio selection that drives these ratios.
Failure Modes and Cost-Reduction Levers
The three highest-cost failure modes in fielded wind gearboxes are white-etching cracks on rolling-element bearings, macropitting and micro-pitting on gear flanks, and ring-gear tooth-root fatigue in planetary stages; all three are sensitive to lubricant cleanliness, load spectrum, and surface-grinding quality [S2][S3]. Industry response documented in the literature has been to lengthen service intervals by improving filtration and oil-quality monitoring, and to push bearing and gear suppliers like SKF and Timken to certify components for 25 to 30 year operational cycles, which raises piece cost 5 to 15 percent but reduces lifetime O&M more [S4].
Operational levers that compress lifetime cost without redesigning the box: condition-monitoring retrofits (vibration, oil-debris, magnetic-plug sensors), tighter oil cleanliness targets (e.g. NAS 7 or better), and torque-density derating in low-wind sites. For new builds, the cost levers are gear-steel grade (case-hardening vs. through-hardening), grinding accuracy class (DIN 5 vs. DIN 6), and bearing internal clearance selection for the site's load spectrum [S1][S2]. A useful reference for the measurement instrumentation and sensor side of these retrofits sits in the condition-monitoring stack rather than the gearbox itself.
Standards, Sourcing, and Market Structure in 2026
Gearbox design follows AGMA, ISO 6336, and DIN 3990 load-capacity frameworks, with bearing selection dominated by ISO 15 and ISO 76; certification pathways for offshore units additionally require DNV, Lloyd's Register, or Bureau Veritas type approval depending on the developer's insurer. OEMs led by Siemens Gamesa, with tier-1 gearbox suppliers including ZF Friedrichshafen, Winergy, China High Speed Transmission, and Nanjing High Accurate Drive, set the cost benchmark that all new designs are measured against [S4]. Supply-chain risk in 2026 centres on specialty steel procurement and power-electronic semiconductor availability, both of which influence gearbox manufacturing lead time and thus effective project cost [S4].
Decision-relevant signals to watch: gearbox warranty terms published by each OEM (typically 5 years on a new unit, extendable), service-replacement versus new-build ratio in OEM order books (rising service share = market shifting from CAPEX to OPEX), and the Industry 4.0 retrofit pipeline at fleet operators, which is where the next round of O&M-cost compression is most likely to land [S2].
For the relevant spec sheets and selection criteria, see additive manufacturing material.