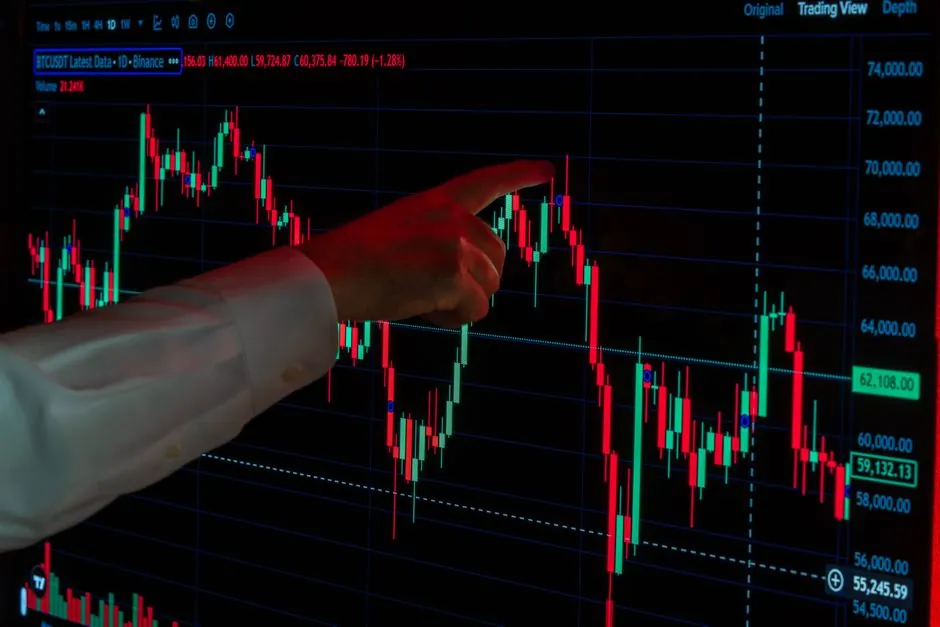
US average retail electricity prices are projected to climb roughly 3–5% year-on-year in 2026, driven by higher natural-gas input costs, grid-hardening capex, and load growth concentrated in hyperscale data centers [S10]. The IEA's mid-year update puts global electricity demand growth at 3.6% for 2026, accelerating to 3.8% in 2027, up from 3% in 2025 [S2].
For large commercial and industrial (C&I) buyers the implication is straightforward: wholesale prices are not merely higher on average, they are spikier, and the spread between peak and off-peak is widening. In January 2026 the polar vortex pushed spot electricity prices to roughly 50x normal levels in affected US regions, and facilities running manual or non-automated processes largely missed the curtailment window [S6]. That single event crystallises the procurement question for the next 24 months: how do you monetise the spread instead of being run over by it?
What is actually moving the price in 2026
Three structural drivers dominate the 2026 outlook. First, AI and hyperscale data-center load: the largest new-build clusters sit in Texas, Virginia, Georgia, and parts of the Midwest, and they are reshaping regional load curves hour by hour, tightening reserve margins in PJM, ERCOT, and NYISO [S1]. Second, electrification across transport, building HVAC, and process heat is raising baseline demand faster than many integrated resource plans anticipated, with ERCOT planning scenarios showing meaningful year-over-year load growth for 2026 [S1]. Third, the fuel and capex stack: higher gas input costs, grid-hardening investment, and disaster-recovery / climate-resilience spending are layered on top of the demand surge, and Columbia's 2026 review found US residential prices rose at more than twice the rate of inflation in 2025, a break from the 2019–2024 pattern of roughly tracking CPI [S4].
In Europe the picture is different in source but similar in effect. Schischke and Rathgeber's March 2026 panel and country regressions across 13 European markets (2015–2023 data) find that nuclear and coal capacity stabilise wholesale prices, higher solar shares increase volatility, wind is mostly stabilising except in Spain, and total electricity load plus the Russia–Ukraine war remain the dominant risk amplifiers [S3]. ACER's March 2026 key-developments report documents that extreme-temperature episodes in the 2025–2026 winter materially shifted demand patterns and triggered price responses across coupled EU markets [S8].
Where the volatility shows up: ERCOT, PJM, CAISO, and EU coupled markets
ERCOT is the cleanest case study. New data-center, industrial, and West-Texas oil-and-gas load is landing on a system whose planning reserve margin has been thin for years, and 2026 scenarios point to meaningful year-over-year growth even before accounting for full energisation of announced projects [S1]. PJM's regulatory uncertainty is a separate risk: how large data-center loads are integrated into long-term capacity planning is still under debate, and the outcome will move capacity prices, congestion charges, and interconnection queues for years [S1]. California and Maine have already absorbed acute residential price increases through 2025, while Iowa, Nebraska, and Nevada saw real-terms declines, evidence that the same national drivers produce divergent regional outcomes depending on generation mix and capex exposure [S4].
Europe's volatility is increasingly weather-driven and renewable-driven rather than gas-driven. The 2026 literature finds solar penetration raises measured price volatility in most markets, while wind is neutral-to-stabilising except in Spain, where it amplifies swings [S3]. Combined with cold-snap demand pulses documented by ACER [S8], this means European industrial buyers should plan for sharper daytime price spreads in solar-heavy hours, not just higher averages. The Oxford Institute's OEF-147 (March 2026) underlines that even where wholesale prices have eased since the 2022–2023 crisis, business electricity bills remain structurally high because of network charges, levies, and capacity cost recovery [S9].
Demand response in 2026: economics, program design, and what's different
Demand response is no longer a sustainability add-on; it is a structural tariff instrument. ESIG's January 2025 review frames DR as a reliability and price-stability tool, capable of dampening wholesale price spikes when enrolled capacity is large enough and dispatchable enough to matter at the system operator level [S7]. By June 2026 the program landscape had tightened: sustained grid volatility from hyperscaler load growth and baseline electrification is pushing grid operators to restructure tariffs, with the practical effect that the reward per kW of curtailable or shiftable load is materially higher than in 2023–2024 [S5].
The economic stack for an industrial site now has four layers, not one. Layer one is capacity payment or reservation credit for being available to curtail during system events. Layer two is energy payment for the kWh actually curtailed or shifted during dispatch. Layer three is ancillary-services revenue (frequency regulation, spinning reserve, voltage support) for assets with the right response time and telemetry, typically sub-second to sub-minute, which fits electricity-meter infrastructure and power-quality monitoring rather than average revenue metering. Layer four is hedge value: the avoided premium paid for spot exposure during the top 100–200 peak hours of the year, which is where the 50x vortex spikes and solar-driven duck-curve ramps actually land [S6][S3]. For a plant running 24/7 with 5–15 MW of shiftable load (compressors, chillers, electrolysers, certain furnace cycles), the all-in 2026 revenue potential frequently clears the full cost of an automated curtailment control system inside two to three event seasons.
Decision criteria: who demand response is for, and who it is not
DR is for sites that can (a) tolerate 1–4 hour curtailment or shift windows without process damage, (b) measure and verify load change at the 1-minute or better interval, and (c) accept a settlement structure that pays for availability, not just for delivered energy. It is not for sites with continuous-stochastic processes (certain glass furnaces, semiconductor diffusion, batch pharma reactors with tight residence-time control) where a curtailment signal equals lost batch revenue, or for sites lacking the metering, SCADA, or on-site controls to dispatch automatically within the program's notification window. [S3]
Four criteria separate programs that actually pay out in 2026 from those that look good on paper: (1) minimum dispatch granularity, where sub-minute regulation is paid at a structurally higher rate than hourly load-shed; (2) telemetry and verification, with most ISO/TSO programs now requiring interval data better than 1-minute from a revenue-grade electricity-meter or equivalent; (3) baseline methodology, because capacity payments are settled against a calculated baseline that can penalise plants that are already efficient; (4) participation in stacked services, where a site that can ride both regulation and energy-shed markets earns roughly 2–3x the revenue of an energy-only participant, conditional on having the behind-the-meter controls to dispatch reliably [S5][S7].
Comparison: program types against 2026 industrial use cases
Four program archetypes now compete for industrial load. Capacity-only programs (e.g. PJM's capacity-style constructs, ERCOT's emergency response) pay for availability and accept coarser telemetry; they suit sites with limited automation but real shed potential. Energy-only event programs (most utility curtailment tariffs) pay per MWh curtailed during a dispatch and require 1-hour or better metering; they fit plants with flexible batch scheduling. Ancillary-services programs (regulation up/down, spinning reserve, frequency response) pay the highest per-MW and per-MWh rates, but require sub-second to sub-minute response, redundant metering, and audited checking-and-testing-apparatus for verification. Behind-the-meter or self-curtailment structures (virtual PPAs, private-wire arrangements) sit outside the ISO tariff entirely and are emerging as data-center operators and large industrials lock in private generation; this is also the structural driver behind the 2026 M&A wave in private power assets documented in adjacent coverage of 2026 Grid and Data Center M&A: From PPAs to Private Power Assets. [S1]
On cost, the dominant 2026 driver is automation, not hardware: a site that can dispatch automatically versus manually keeps the same meter but captures 2–4x more event revenue per MW of available shed [S5][S6].
Limitations, failure modes, and what to watch through 2027
Three failure modes bite first. Manual curtailment: facilities without automated load-shed missed the 2026 polar vortex window while automated peers captured 50x-normal pricing, because the dispatch-to-curtail interval is shorter than a human decision cycle [S6]. Baseline gaming: plants that have already cut load for efficiency reasons get penalised under standard baseline methodologies, and 2026 tariff restructuring is partly aimed at fixing this, but participation contracts should be modelled against the specific ISO's baseline rule before sign-up [S5]. PJM faces open questions on how to integrate hyperscale data-center load, which could shift capacity prices, congestion charges, and interconnection terms for C&I buyers with multi-year hedges [S1].
For Europe, the data point that matters is solar penetration: every additional GW of utility-scale solar in a price-coupled market tends to widen intraday spreads and raise measured volatility in that market's residual-load hours, even as annual averages soften [S3]. The 2026–2027 watch list: IEA's 3.6% / 3.8% demand-growth trajectory holding through 2027 [S2] and whether 50x-style spike events recur in the 2026–2027 winter [S6]. Industrial buyers who can wire up automated curtailment, install revenue-grade interval metering, and stack capacity, energy, and ancillary-services revenue into a single dispatch asset will capture the spread that 2026 is now paying out.
For component-level specifications, see construction machinery and equipment.