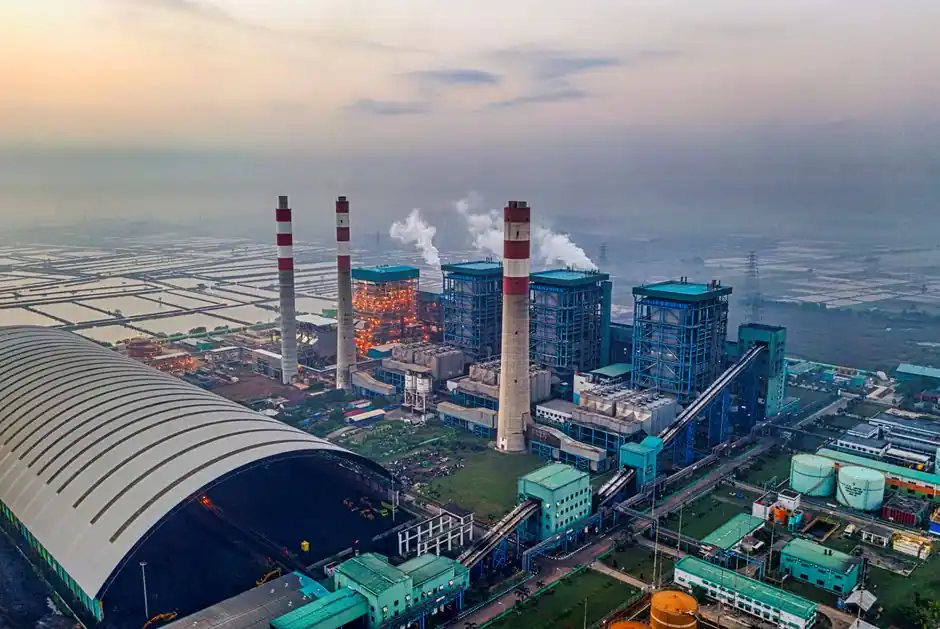
EU electricity prices for energy-intensive industries remained elevated in 2025, averaging more than twice US levels and nearly 50% above other major developed-market levels [S1].
The price signal affects electricity- and trade-intensive plants across chemicals, glass, metals, paper, rubber, plastics, cement and selected semiconductor production, with German support structured for 2026–2028 [S2][S3].
What the 2026 Power Price Environment Changes
EU prices for energy-intensive industries rose by about 53% between 2019 and 2024, compared with an increase of about 33% for households [S3]. Energy and supply costs form the largest part of the end-user bill, while network charges, VAT and other taxes are also material, so a factory’s delivered electricity price cannot be reduced through procurement alone [S3].
European policy also links electricity consumption with decarbonization. The Clean Industrial Deal targets a rise in electricity’s share of EU gross final energy consumption from 23% in 2024 to 32% by 2030, but euro-area electricity consumption had already fallen 6.3% between 2015 and 2023 [S3]. The result is a mixed market: structurally higher industrial tariffs can coexist with weak aggregate demand and substantial variation among member states.
For operators, the practical issue is the spread between the marginal value of production and the full cost of electricity, including network charges and taxes. Plants with flexible loads can respond to price signals, while baseload processes with little ability to reduce consumption need long-term contracts, efficient assets or direct site interventions [S2][S3].
Germany Defines the Relief Mechanism
Germany's approved instrument covers production facilities in 91 electricity- and trade-intensive sectors during 2026–2028, with several thousand companies potentially eligible [S2]. Eligible groups include chemicals, glass, rubber and plastics, plus parts of semiconductor manufacturing [S2].
The support does not create a universal fixed tariff. Companies continue buying electricity at market prices, while the state can subsidize the difference to a calculated target of about 5 euro cents/kWh for a limited share of eligible consumption [S2]. A more detailed account sets the maximum relief at 50% of wholesale electricity price, using the one-year forward price fixed on January 1 as the reference, with 50% of a production facility’s electricity consumption eligible and heat, steam and compressed-air consumption considered where indirect [S4].
These rules make the support economically different from a standard discounted contract. The value of the relief depends on the reference price and eligible load [S4].
Which Plants Can Use the Subsidy
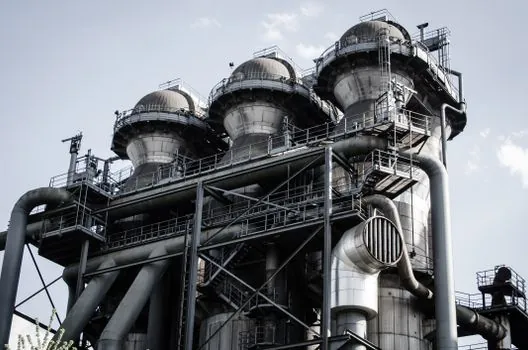
The mechanism is strongest where electricity materially affects production cost and the plant can document eligible consumption. Potentially covered industries include chemicals, glass, rubber and plastics products, and parts of semiconductor manufacturing [S2].
It is not designed for every electricity user. Office loads, ordinary service facilities and electricity-intensive sectors outside the eligible list do not become eligible merely because they consume power.
That condition favors sites with a credible capital project, but it can be a poor fit for a producer with high power intensity, limited financing capacity and no identified efficiency or storage project.
German Aid Compared With Direct Energy Measures
Direct efficiency investment normally reduces consumption, whereas the German mechanism reduces the supported portion of the bill for eligible sectors and also requires decarbonization spending [S2][S4]. The two routes therefore address different decision problems, and a plant should compare them by eligible load, implementation time, capital requirement and controllable operating savings.
Equipment decisions should follow the load profile rather than the headline tariff. A power distribution box is relevant where metering, protection and load segmentation support independent control, while a power transformer matters when site voltage, capacity or resilience drives the upgrade. Neither automatically qualifies a plant for aid, and neither replaces the required consumption evidence.
US Load Growth Adds a Different Price Pressure

US residential electricity prices rose by more than twice the rate of inflation in 2025, breaking the 2019–2024 pattern in which average retail prices broadly tracked inflation [S5]. The increase was uneven: acute pressure in states including California, Maine and Maryland contrasted with real declines from 2019 to 2025 in Iowa, Nebraska and Nevada [S5].
The drivers are layered rather than attributable to demand alone. Grid replacement and hardening, extreme-weather and wildfire recovery, natural-gas price volatility, regulatory mandates and new demand from data centers and energy-intensive manufacturing all affect system costs [S5]. US industrial planning therefore cannot apply one national escalation assumption; tariff design, state regulation, generation mix and allocated network costs need to be assessed by service territory.
Beneficiary-pays approaches are emerging as regulators try to prevent infrastructure costs created by high-growth loads from shifting to households. Data-center-specific tariffs and state or federal measures are part of that response, but their allocation rules remain jurisdiction-specific [S5]. For energy-intensive producers, this adds another decision variable beyond the generation component of the power bill.
Failure Modes in Cost-Reduction Projects
A subsidy calculation can be overstated if a plant treats all meter load as eligible. Germany’s mechanism limits support to a share of consumption, requires verification above 10 GWh, and excludes at least 50% of the subsidy from unrestricted use by requiring decarbonization investment within 48 months [S2][S4]. A spreadsheet model based on total annual kWh will therefore overstate realizable savings.
Efficiency projects can also miss their expected savings if they address non-discretionary losses or unmeasured consumption. The bill contains energy and supply costs, network costs, VAT and other taxes, so a lower energy component does not translate one-for-one into the delivered-price reduction [S3]. Operators need verified baselines, interval consumption data and production-normalized targets before committing capital.
Storage is not a universal hedge. Its economics depend on charging windows, tariff structure, battery degradation, cycle frequency and the plant’s ability to interrupt or reschedule production. In Germany, storage can also count as a qualifying flexibility investment when it supports the linked decarbonization condition [S4]. The engineering case must therefore combine electricity data with operating constraints.
How to Evaluate a 2026 Production Decision

Start with four measured inputs: delivered EUR or USD/kWh, eligible electricity in GWh, annual production volume and the share of consumption that can be reduced or shifted. German facilities should separate market purchases from the calculated subsidy, then apply the 5 euro cents/kWh target, 50% consumption ceiling and 48-month reinvestment condition [S2][S4].
Second, test three investments independently: efficiency, on-site generation with controllable consumption, and storage or demand flexibility. Compare each on annual kWh avoided or shifted, contribution margin, capital cost and implementation time. Use production interruption and technical risks as explicit constraints rather than assuming every kWh has the same economic value [S4].
Third, verify the procurement route. In Germany, BAFA manages applications, with the process scheduled to begin at the start of 2027 for qualifying 2026 consumption [S2][S4]. For a plant already operating a power distribution cabinet, metering and switching capability can support the evidence needed for energy-management decisions, but public subsidy eligibility remains a separate regulatory determination.
The trackable signals for industrial planning are the delivered tariff by site, network-cost growth, eligible-load rules, reference prices for support calculations and project capital costs. A plant can use those five inputs to compare continued production, partial curtailment, efficiency investment and site-specific energy supply on a consistent financial basis.