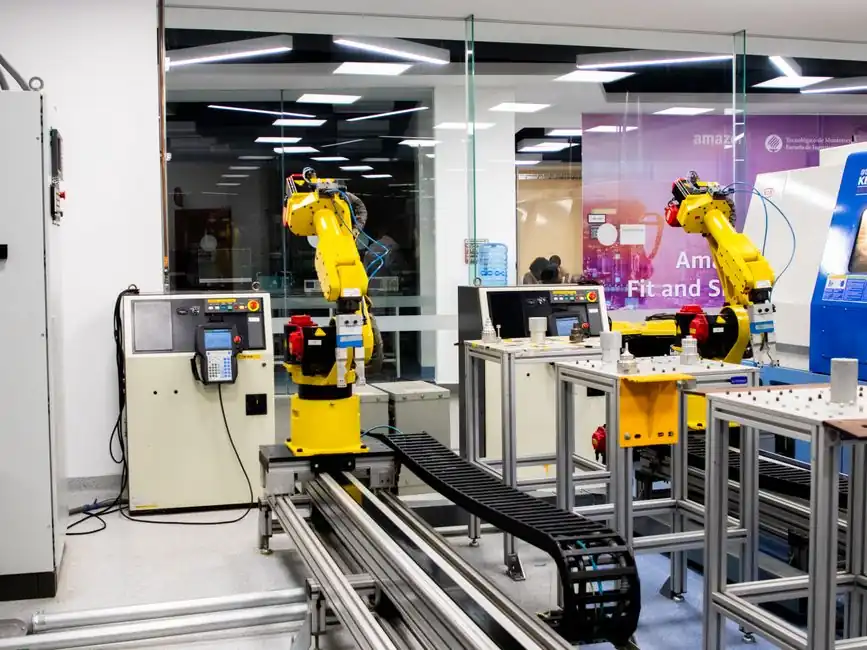
Intel, Samsung, TSMC, ASE Technology, and Amkor Technology control the leading positions in advanced packaging, with four large international OSATs completing the top tier alongside the foundry and the two IDMs [S1]. Together, the 2025 advanced packaging market was valued between USD 43.95 billion and USD 51.65 billion depending on segmentation, with forward projections ranging from USD 69.71 billion (5.26% CAGR) to USD 140.38 billion (11.75% CAGR) by 2031–2034 across published forecasts [S2][S3][S4][S5].
Asia Pacific is the structural anchor: the region captured 60.57% of 2025 advanced packaging revenue per Mordor Intelligence, and 45.3% per Market Data Forecast, with Taiwan, South Korea, and China driving foundry, OSAT, and consumer-electronics packaging clusters [S3][S4][S5]. The North American sub-region is forecast at 24–28% share for 2025, with the United States alone representing 76–80% of that regional total, and Europe at 18–22% [S5].
Market Sizing: 2025 Baseline and 2031–2035 Projections
Across six published 2026-vintage forecasts, the 2025 advanced packaging baseline clusters between USD 40.86 billion and USD 51.65 billion, with the 2026 step ranging from USD 44.07 billion to USD 57.72 billion [S1][S2][S3][S4][S5][S6]. Fortune Business Insights pegs 2025 at USD 45.13 billion rising to USD 48.75 billion in 2026 and USD 94.33 billion by 2033; Mordor Intelligence projects USD 51.62 billion (2025), USD 57.46 billion (2026), and USD 90.11 billion (2031) at a 9.42% CAGR [S2][S3].
Market Data Forecast and Towards Packaging are the more aggressive projections at 11.75% and 7.59% CAGR respectively, while The Insight Partners takes the conservative line at 5.26% CAGR to USD 69.71 billion by 2034 [S1][S4][S5]. Business Research Insights limits its scope and prints USD 17.97 billion in 2026 reaching USD 31.84 billion by 2035 at 6.5% CAGR, illustrating how much the size swings based on whether flip-chip mainstream packaging is counted [S6].
Vendor Map: IDMs, Foundry, and the OSAT Tier
The top tier of the advanced packaging market is a three-block structure: two large integrated device manufacturers (Intel and Samsung), one foundry with significant packaging capacity (TSMC), and four sizable international OSATs led by ASE Technology Holding, with Amkor Technology, JCET Group, and Powertech Technology typically rounding out the roster [S1][S5]. The Insight Partners' company list also includes Qualcomm, IBM, Semiconductor Manufacturing International Corporation (SMIC), SÜSS MicroTec, and United Microelectronics Corporation (UMC) as tracked competitors [S5].
TSMC reported shipping more than 15,000 3D IC and advanced packaging units, anchoring its position as the foundry-led packaging leader, while Intel and Samsung continue to push their own platforms (Foveros, EMIB, X-Cube, and 4nm/3nm packaging variants) for in-house silicon [S3]. ASE and Amkor remain the highest-revenue pure OSATs, with ASE consistently leading the OSAT ranking and Amkor in second place across the latest annual disclosures; JCET, the largest China-headquartered OSAT, rounds out the top three. China’s domestic push, including SMIC, Hua Hong, and Tongfu, has accelerated the local OSAT consolidation but remains a step behind in hybrid bonding and high-end fan-out tooling.
Platform Mix: Flip-Chip, WLP, 2.5D, and 3D
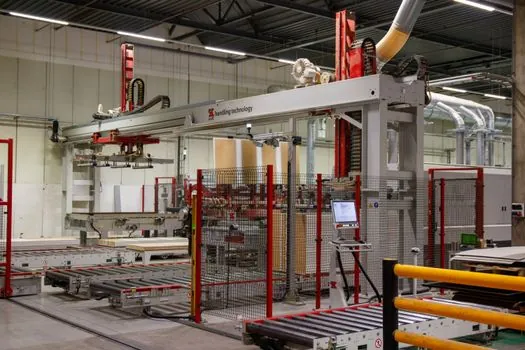
Flip-chip dominated 2025 shipments with 41.37% platform share per Mordor, and The Insight Partners corroborates a 38–42% share band, reflecting its maturity, high I/O density, and entrenched use in CPU/GPU and mobile baseband packaging [S3][S5]. Solder-bump interconnect technology retained 58.92% of 2025 share, but hybrid bonding is on track for a 10.02% CAGR through 2031 as sub-10-micron pitch becomes the requirement for AI accelerators [S3].
2D ICs accounted for 73.71% of 2025 unit shipments, while 3D ICs integrating through-silicon vias are growing at 9.55% CAGR [S3]. Fan-out wafer-level packaging and 2.5D interposers are the two most active development lanes, with panel-level packaging projected at a 9.72% CAGR and 3D IC packaging holding a 10–14% share in 2025 growing at 6.6–7.0% [S3][S5]. For background on the broader wafer-level formats and material flows, see the advanced packaging material reference and the vacuum and pressure-controlled packaging equipment notes.
End-Use Mix: Consumer Electronics, Auto/EV, HPC
Consumer electronics commanded 48.77% of 2025 advanced packaging revenue per Mordor, with smartphone production exceeding 1.4 billion units in 2023 cited as the structural pull for fan-out and flip-chip [S3][S4]. Automotive and EV applications are the fastest end-use lane, growing at 10.11% CAGR through 2031 as silicon-carbide power modules require copper-pillar or hybrid-bond connections that legacy wire-bond cannot survive under thermal cycling [S3].
HPC and AI accelerator demand, plus 5G rollout (global 5G subscriptions surpassed 1.1 billion in 2023 per Ericsson), are pulling chiplet and HBM-stacked packaging volumes, with data center processor shipments growing 12% in 2023 per Gartner [S4]. For context on how packaging demand is intersecting with semiconductor lithography capacity, the lithography equipment 2026 vendor map covers the four-vendor core (ASML, Nikon, Canon, and a tightly limited Chinese supply).
Regional Share and Capacity Investment
Asia Pacific’s 60.57% (Mordor) to 48–52% (The Insight Partners) share band is built on Taiwan (TSMC + ASE + Powertech), South Korea (Samsung + Amkor Korea), and China (JCET, Tongfu, SMIC, Hua Hong) [S3][S5]. The Middle East and Africa is the fastest-growing region at 9.61% CAGR through 2031, while North America (24–28% share) and Europe (18–22% share) are growing on CHIPS Act, EU Chips Act, and Korean K-CHIPS subsidy programs [S3][S4][S5].
Capacity additions remain skewed to advanced nodes and advanced packaging co-located with fabs: TSMC continues to expand CoWoS, InFO, and SoIC lines; Intel is ramping Foveros and EMIB at Ohio and Arizona; Samsung is scaling 3nm/4nm packaging at Pyeongtaek; and ASE, Amkor, and JCET are adding OSAT capacity in Vietnam, Portugal, and Shanghai respectively. The semiconductor packaging market as a whole (broader than the "advanced" subset) was USD 76.86 billion in 2025 and is expected to reach USD 144.18 billion by 2033 at 7.6% CAGR per industry forecasts [S7].
Selection Criteria: How Buyers Read the Vendor Map
Procurement and product teams sourcing advanced packaging capacity in 2026 typically rank vendors on four criteria: (1) platform coverage, specifically whether the OSAT or foundry supports 2.5D/3D and hybrid bonding, (2) geographic diversification of fab sites to mitigate export-control and tariff risk, (3) qualified-package list (QPL) status for the target end market (automotive AEC-Q100, medical ISO 13485, defense), and (4) lead time on substrates and glass-core interposers, which remains the dominant constraint [S3][S4][S5].
For chiplet and HBM-heavy AI accelerator programs, TSMC’s CoWoS-S/L and SoIC are the default reference, with ASE and Amkor as overflow capacity for less critical tiles. For consumer-mobile fan-out, ASE, Amkor, and JCET remain competitive on cost and yield, while Samsung’s 4nm packaging line targets in-house Galaxy and external Qualcomm Snapdragon variants. For automotive-grade AEC-Q100 packaging, Amkor’s Portugal and Vietnam sites, ASE’s Korea/Taiwan/China footprint, and JCET’s Shanghai lines are the most cited qualified sites across Tier-1 OEM audits.
Failure Modes and Constraints to Track
The three structural constraints that have not loosened in the past 12 months are: substrate supply (especially ABF and glass-core), hybrid-bonding tool throughput (Besi and ASMPT are the dominant suppliers), and thermal warpage control on large panel formats [S3][S4]. Hybrid bonding remains capped at sub-10-micron pitch, and panel-level packaging is still transitioning from R&D to high-volume manufacturing with Samsung, Intel, and several OSATs running pilot lines.
For a regional cross-reference on advanced packaging vendor share and the technology mix, the chip packaging market share 2026 vendor map covers the same vendor set with a stronger technology-by-region cut. Readers comparing adjacent industrial materials, including battery cathode capacity for EV power modules that also pull advanced packaging demand, can refer to the cathode material production capacity planning coverage.
Trackable signals for the next 6–12 months: (a) CoWoS monthly wafer output from TSMC quarterly calls, (b) Intel 18A/20A packaging ramp milestones at Arizona and Ohio, (c) ASE, Amkor, and JCET quarterly capex disclosures for panel-level and hybrid-bonding tools, and (d) any CHIPS Act pre-disbursement milestones for advanced packaging-specific line items. Readers wanting to cross-check logistics and packaging-material flows for industrial supply chains can also consult the logistics and packaging reference.