
Acquisition price is roughly 38% of the operational challenge in owning aerial work platforms, with maintenance expenses affecting 31% of fleets and operator certification requirements impacting 29% of ownership cost decisions, according to 2026 fleet-operator data [S3].
Globally, more than 1.6 million aerial work platform units were operational in 2025, up from about 1.4 million in 2022, with scissor lifts at 42% of deployment and boom lifts at 36% of active fleets [S3]. Rental penetration exceeds 79% of United States equipment demand, and electric models reached 31% of newly delivered units in 2025, a mix that reshapes how lifecycle cost is calculated [S3].
What Total Cost of Ownership Actually Includes
True cost of ownership for an aerial work platform starts with the purchase price, but extends through fuel, scheduled maintenance, insurance, financing, taxes, training, and residual value, with operators advised to sum those line items and subtract expected resale to land on a net lifecycle figure [S4][S8].
Industry tracking of ownership drivers lists equipment acquisition costs at 38%, maintenance expenses at 31%, operator certification at 29%, replacement component costs at 24%, and transportation logistics at 18% of operational challenge across surveyed fleets [S3]. The same dataset records 47% telematics integration, 34% remote diagnostics penetration, and 28% smart fleet monitoring adoption, all of which move maintenance cost off the balance sheet when deployed at scale [S3].
Acquisition Cost Versus Operating Cost, the Real Split
A checklist grounded in heavy-equipment ownership practice groups TCO into thirteen items: learning curve, operator morale, brand signal, build quality, setup and teardown time, job versatility, future-proofing, mandatory service intervals, proprietary parts, manufacturer support longevity, warranty coverage, residual value, and financing plus tax exposure [S4]. Each item converts into a specific dollar line on a 5- to 10-year hold.
Comparative cost-driver ranking, drawn from 2026 fleet-operator surveys, places acquisition first (38%), preventive maintenance second (31%), and operator certification third (29%), ahead of replacement components (24%) and transport (18%) [S3]. Battery-electric units shift the stack: telematics-equipped units reached 44% of new deliveries, and battery efficiency improved 18% year-over-year, which lowers fuel cost but raises battery-replacement reserves on the same TCO sheet [S3].
Electric Versus Diesel Versus Hybrid, Cost Drivers Compared
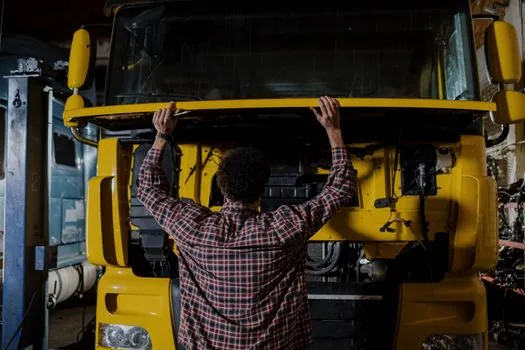
Electric platforms are expected to lead fuel type in 2026 with 42.0% share because low-noise operation keeps battery machines eligible for indoor and occupied sites, while gas and diesel platforms still command 55%+ market share but grow at only 5.5-6.0% CAGR against 25-28% annual growth for electric in developed markets [S2][S5].
Two cost curves now run in parallel. Diesel and gas machines carry lower acquisition cost but higher fuel and emissions-control maintenance, while electric machines trade higher upfront battery cost for 18% battery-efficiency gains, 47% telematics integration, and 34% remote-diagnostics penetration that compress unplanned downtime [S3]. For indoor warehouse and food-grade work, electric units earn their premium by avoiding exhaust extraction and night-noise penalties. For outdoor and remote-site work, diesel-hybrid units still win on fuel infrastructure and shift length.
Height Class and Machine Type, How Selection Moves the TCO Curve
Below 10M platforms are set to lead platform height with 33.0% share in 2026 due to compact dimensions that simplify transport and doorway access, while the 10-20M segment holds 65%+ dominance at $8.7-9.2 billion and grows at 6.5-7.0% CAGR [S2][S5]. Boom lifts hold 56.0% of 2026 product-type share, scissor lifts dominate deployment at 42%, and boom lifts are the fastest-growing type at 8.5% CAGR as utilities and logistics extend reach requirements [S2][S3][S5].
Selection impact on TCO is direct. Compact sub-10M units cut transport and mobilization cost, the 10-20M workhorses absorb the bulk of the rental revenue hour mix, and 21-30M or above-30M booms command premium day rates that justify higher acquisition and certification cost only on long, high-reach projects. Choosing the wrong height class multiplies transport cost, which already accounts for 18% of operational challenge, and inflates the 24% replacement-component line through accelerated wear on out-of-spec deployment [S3].
Rental Versus Purchase, the TCO Decision Gate

Rental service providers demonstrate 9.5-10.5% CAGR and are projected to expand share against OEM direct sales, which represent 35% of revenue at $4.7-5.2 billion, because fleets can defer orders when utilization weakens and service-cost plus residual-value assumptions determine whether another machine earns acceptable returns [S2][S5].
The buy-versus-rent gate runs on three numbers: expected annual utilization, local parts and field-service coverage, and residual value at year 7 or 10.
Telematics, Battery, and Certification, the New TCO Multipliers
Adoption rates in 2025 set a new cost baseline: 47% telematics integration, 44% telematics-equipped new units, 37% safety system adoption, 34% remote diagnostics penetration, 29% fleet digitization implementation, and 31% electric platform share, with lithium-powered equipment at 22% [S3]. These features move TCO because telematics converts unplanned service into scheduled service, remote diagnostics cuts field-truck rolls, and lithium batteries extend cycle life versus lead-acid on deep-discharge duty cycles.
Operator certification, at 29% of operational challenge, is the most controllable line item: documented training programs, refresher cycles, and on-machine interlocks lower incident cost, insurance premiums, and OSHA-recordable exposure. A fleet running mixed aerial work trucks and self-propelled booms should standardize one certification track per machine class rather than maintain parallel schemes.
Market Sizing and Fleet Signals to Watch
Three published 2026 baselines frame fleet planning: USD 13.1 billion in 2026 growing to USD 24.6 billion by 2036 at 6.5% CAGR, USD 13.3 billion in 2026 reaching USD 21.6 billion by 2033 at 7.2% CAGR, and USD 16.05 billion in 2026 projected to USD 19.22 billion by 2035 at 2.02% CAGR [S2][S3][S5]. The spread is wide because methodology differs, but every published estimate points to expanding fleet hours, which tightens the TCO pressure on maintenance and certification lines.
Trackable signals for the next planning cycle: 31% electric platform share climbing toward 35-38% by 2033, 79% US rental penetration as the floor for fleet-versus-purchase math, 47% telematics integration as the new preventive-maintenance baseline, and 22% lithium-powered share that sets the battery-replacement reserve [S3][S5]. Fleet owners running an aerial work platform mix that does not match those ratios should expect higher per-hour TCO through 2027 as service and certification lines reprice against the new fleet standard.
The underlying component specifications are covered under total station.
See also our earlier report, Air Pick Selection for Concrete Work: Class, Air Use, and Aggregate Map.