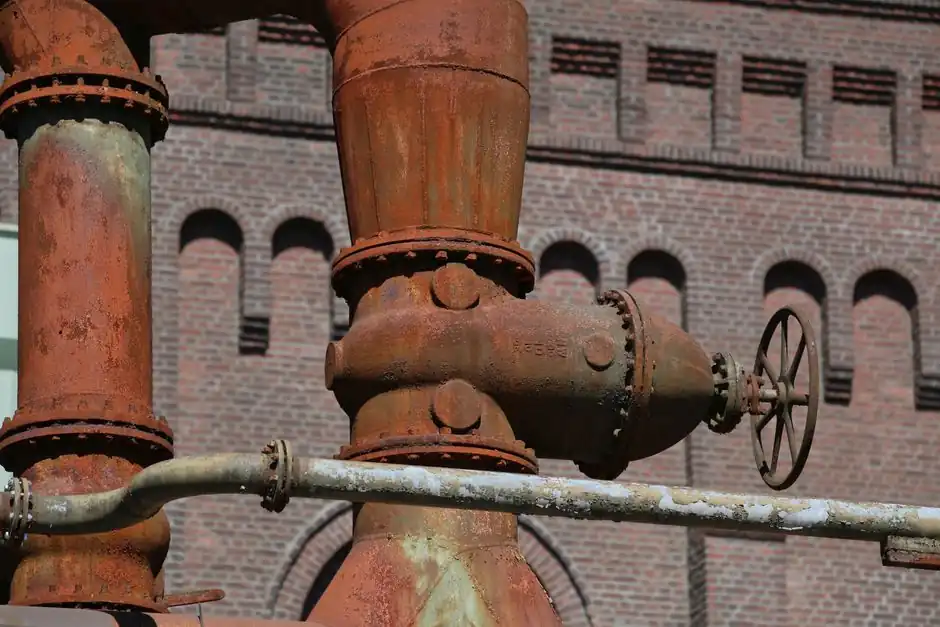
A balanced balancing valve selection cannot be made on unit price alone: freight, certification scope, energy-driven pumping cost, and rebuild frequency typically account for the majority of 10-20 year lifecycle spend, with conventional globe-style hardware rebuilding every 6-18 months versus 2+ year service intervals on severe-service designs [S3].
Total cost of ownership (TCO) for industrial valves spans purchase price, freight and duties, inventory carrying, incoming inspection, installation labor, energy losses across the valve, scheduled maintenance, unplanned downtime, and end-of-life disposal [S1][S5].
What TCO Actually Counts in a Balancing Valve Budget
A complete TCO build for a balancing valve requires six buckets: acquisition (unit price + freight + duties + inventory carrying), installation (labor, fittings, calibration, flushing), energy (pumping energy wasted across the valve over its operating hours), maintenance (scheduled service, rebuild kits, gasket sets), downtime (planned + unplanned lost production), and end-of-life (disposal, residual value, replacement mobilization) [S1][S5].
The make-vs-buy equation used by procurement teams explicitly lists variable cost per unit, annual fixed overhead, tooling amortized over tool life, and quality/rework rate on the in-house side, and purchase price, shipping, annual management cost, and incoming quality rate on the outsource side [S2]. The same line items translate directly to a ball valve or balancing-valve sourcing decision, with the breakeven volume shifting whenever any single input moves.
HVAC data shows that a $28,000 rooftop unit can carry a total lifecycle cost exceeding $120,000 once energy and maintenance are included, and the same ratio (purchase = roughly 20-30% of lifetime cost) holds for hydronic balancing hardware on a chilled-water loop [S5].
Cost Driver Ranking: Where the Money Actually Goes
Ranking the TCO drivers for balancing valves from highest typical impact to lowest: (1) energy loss across the valve, dominated by Cv sizing and the authority ratio on the circuit; (2) maintenance and rebuild cycles, where conventional trims need service every 6-18 months versus 2+ years for severe-service designs [S3]; (3) installation labor and commissioning, including flow measurement and Cv verification; (4) freight, duties, and inventory carrying on imported product, with offshore transit variability adding weeks unpredictably [S1]; (5) incoming inspection, rework, and warranty claims tied to quality rate [S2]; (6) opportunity cost from stockouts during long lead-time resupply [S1].
The make-side total annual cost formula TC_make = (V_m × Q) + F_m + (T / L) + C_q,make explicitly captures how tooling life (L) and quality/rework (C_q) shift the equation: halving tooling life or doubling rework rate moves the in-house cost more than a 10% material increase would [S2].
For balancing valves in HVAC and data-center chilled-water loops, the energy bucket typically dominates over 15-20 year service life, because pumps run continuously and any excess head the valve wastes shows up on the kWh meter every hour the plant is operating.
Comparison: Sourcing Routes and Valve Architectures on TCO Criteria
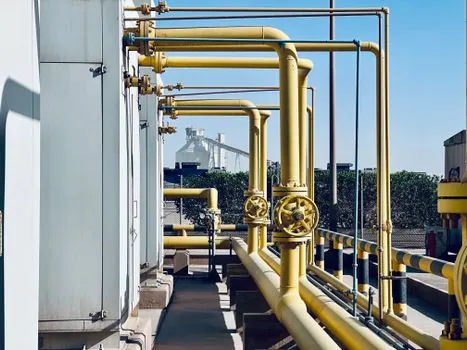
On a 10-year TCO basis, four sourcing/architecture options line up against decision criteria as follows. Domestic manufacture with vertical integration typically scores best on lead time predictability and engineering iteration speed, but ranks higher on unit price for commodity ball valve and quick-disconnect SKUs [S1]. Offshore sourcing often wins on unit price for standard sizes, but loses on freight, duties, and inventory carrying because extended lead times force safety stock and warehouse space [S1].
Severe-service axisymmetric control valves (e.g. Atlas SSCV) score best on maintenance and downtime because 10+ year trim life and 2+ year service intervals replace the 4 rebuilds-in-2-years pattern of conventional globe valves, with noise under 60 dB versus 85-120 dB and 6,000 PSI (ANSI Class 2500) pressure rating versus 2,500 PSI on standard globes [S3]. Conventional globe valves score lowest on energy and maintenance, even though their purchase price is the lowest of the three [S3].
Pilot-operated bypass valves become economically advantageous versus conventional relief configurations in applications exceeding 5-7 years of continuous service, because their higher first cost is amortized over a longer maintenance-free interval [S7].
Installation, Commissioning, and the Hidden Labor Bucket
Installation and commissioning on a hydronic balancing valve routinely costs more than the valve itself, because the work includes pipe fitting, flanging or grooving, flushing, chemical cleaning, and a measurement traverse with a calibrated total station-grade flow meter to set the design Cv against the design ΔP [S1][S5].
Offshore-supplied valves compound this bucket: port congestion and customs clearance variability add weeks to a delivery without warning, and time-zone differences slow down technical questions, often delaying production by 24 hours per query [S1]. Engineering iteration cycles on custom designs also stretch from days to weeks when the supplier is offshore, because specification questions take days instead of hours to resolve and prototype delays include international shipping and customs [S1].
Build American, Buy American (BABA) requirements and ITAR registration can mandate domestically-manufactured product for federal and defense work, removing the offshoring option entirely on those projects regardless of unit price [S1]. NSF and FDA 21 CFR compliance add a similar constraint on food, beverage, and pharmaceutical builds [S1].
Maintenance, Downtime, and the 6-18 Month Rebuild Trap
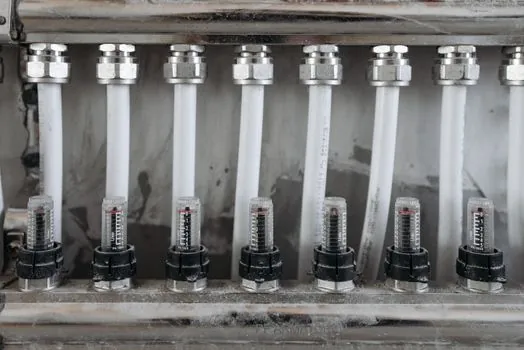
Conventional globe-style control valves in severe service typically need refurbishment every 6 months, with 4 rebuilds in 2 years and 4+ site mobilizations per year, and unplanned shutdown risk is high [S3]. Severe-service axisymmetric designs flip that profile: trim life exceeds 10 years in continuous choked-flow service, service intervals stretch to 2+ years, and the internal helical-gear actuation removes the external actuator failure mode that drives most globe-valve rebuilds [S3].
When late-life repair costs on a major HVAC component run 30-50% of replacement unit value, the repair-versus-replace threshold becomes a TCO call, and a formal lifecycle cost model with energy, reliability, and downtime data should drive the decision rather than a single failure event [S5]. The same logic applies to a balancing valve that has crossed into the late-life phase of its 15-20 year expected service: continued rebuild spend can exceed the lifecycle cost of a replacement with a modern low-loss trim.
Plant turnaround retrofit engineering, when properly scoped, can improve runtime-to-failure, lower TCO, and lift quality and safety, which is why more operators are pulling retrofit evaluations into turnaround scopes rather than running them as separate projects [S6].
Energy: The Bucket That Outgrows Everything Else
Energy consumed by pumps overcoming valve head loss is typically the largest single TCO bucket for balancing valves on continuously operating hydronic loops, because the valve sits in series with the pump and the wasted head accrues every hour. The Atlas SSCV reference of 700:1 control range versus 50:1 for a standard globe valve, paired with its axisymmetric energy dissipation, is the engineering mechanism that drives energy-cost separation over a 10+ year service window [S3].
For HVAC air-side equipment, the same TCO logic shows that matching capacity to actual demand reduces operating cost and wear, cutting the lifetime bill well below the unit price difference would suggest [S4]. On a hydronic balancing valve, the equivalent move is selecting a low-loss trim sized to the design flow rather than oversizing to absorb commissioning uncertainty.
Sourcing Economics: Make vs Buy, Domestic vs Offshore
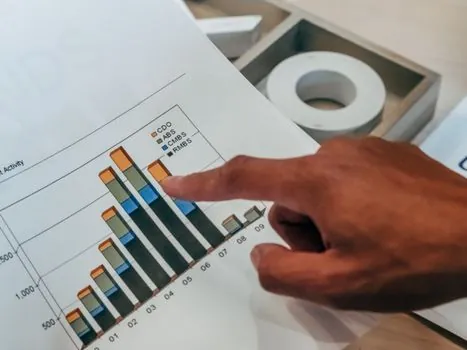
The breakeven logic in a formal make-vs-buy model is sensitive to five inputs: variable cost per unit, annual volume, fixed overhead, tooling cost amortized over tool life, and quality/rework rate [S2]. A representative calculator run on 10,000 units/year with a $25 make variable cost, $32 buy unit price, and $60,000 in annual make fixed costs returns a make total of $310,000, a buy total of $328,000, savings of $18,000 in favor of making, and a breakeven volume of 8,571 units/year [S2].
For balancing valves specifically, the buy side has to absorb shipping cost per unit, annual management cost of issuing and chasing POs, and the incoming quality rate, which is the rework and warranty exposure that domestic supply chains can typically lower through shorter feedback loops [S1][S2]. When those buy-side costs and a realistic 24-hour communication delay per engineering question are added to a 10-year horizon, the buy total can flip above the make total even when unit price is lower [S1][S2].
For a deeper spec-level map of Kv values, sizing rules, and how balancing valves interact with the rest of the hydronic circuit, the related Balancing Valve Pros and Cons: Spec Map, Kv Values, and Sourcing Rules reference is a natural next read. TCO on related control hardware follows the same pattern: for a comparison of how trim architecture and certification scope move the lifetime number on severe-service hardware, the dynamic balancing machine and check valve reference pages cover adjacent selection logic.
Trackable Signals and Next Nodes
Two signals are worth tracking into the next quarter. First, the 5-7 year pilot-operated relief crossover point: any TCO model that places a project's continuous-service horizon inside that window is structurally biased toward conventional hardware, while anything past it is biased toward the higher-first-cost architecture [S7]. Second, the rebuild-frequency ratio: conventional globes at 4 rebuilds in 2 years versus 2+ year service intervals on axisymmetric severe-service designs is the single largest maintenance-bucket delta, and any vendor claim that closes that gap with a different mechanism deserves a side-by-side TCO run against the ball valve and severe-service baselines already documented [S3].