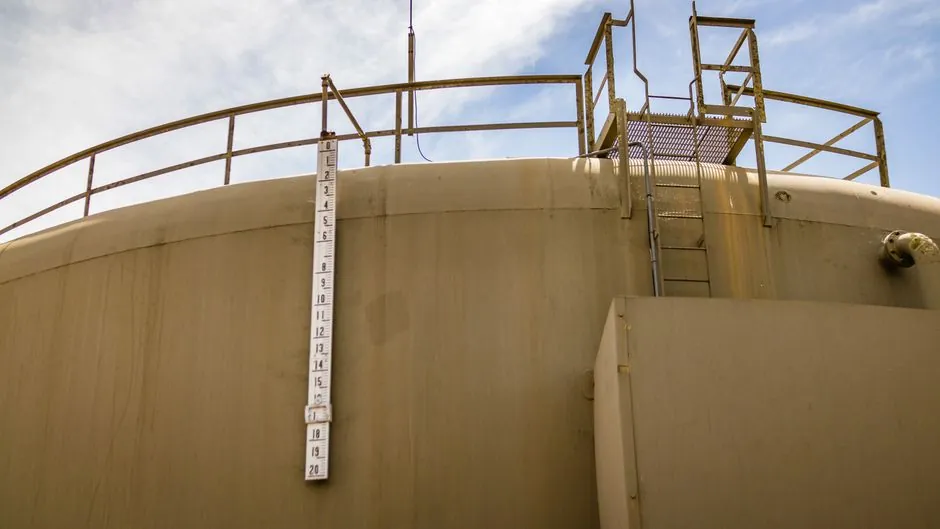
For batch manufacturing, blow tank cycle time is best defined as the Recipe (Plant) Cycle Time, that is, the time the slowest unit operation consumes, and it sets the maximum number of batches per year; batch size is set by the equipment capacity (size) utilization, that is, the vessel with the highest fill ratio [S4].
In a batch manufacturing facility, annual throughput equals batch throughput (size) times the number of batches that can be processed per year, and bottlenecks are either 'size' bottlenecks that limit the batch throughput or 'time or scheduling' bottlenecks that limit the number of batches per year, so enlarging a vessel targets the size bottleneck without removing a scheduling bottleneck [S4]. Engineers should always size the tank against the time bottleneck first, then validate fill ratio, then validate agitator/RT/heating duty, in that order, before signing a P&ID [S1].
The two formulas you write on the whiteboard first
Two working equations anchor the whole exercise. For the schedule side, Cycle Time = 1 / Throughput Rate, with Throughput Rate = Units Produced / Time [S2]. For batch processing, the "unit" is the batch itself, so a pharmaceutical plant running 100 batches in a 40-hour week reports a cycle time of 24 minutes per batch, independent of how many units are inside the batch [S2]. The companion per-unit formula divides total batch time by items in the lot, which only makes sense for finished-goods reporting, not for blow tank sizing [S6].
The second equation is the annual throughput identity: Annual Throughput = Batch Size × Number of Batches per Year [S4]. The "Number of Batches per Year" is bounded above by Available Plant Time / Plant Cycle Time, where Plant Cycle Time is the time the scheduling bottleneck needs to complete one full recipe. A worked example: 10 batches/day × 365 days = 3,650 batches/year, against a 144-minute per-batch cycle, which matches the 2.4 h/batch baseline in the Seeq chemical-batch benchmark [S1].
What the cycle time number actually includes
Effective Machine Cycle Time, as defined by the Lean Enterprise Institute lexicon, is Machine Cycle Time + Load/Unload Time + (Changeover Time / Batch Size) [S3]. Plug in the textbook example: 20 s machine + 30 s load/unload + (30 s changeover / 30 pieces) = 51 s effective. For a blow tank, the load step is usually the pneumatic or hydraulic fill of the vessel, the unload step is the discharge or blow-down, and the changeover is the vessel prep between campaigns, which is why the third term never fully disappears even on long campaigns [S3].
Operator cycle time, machine cycle time, and overall cycle time each catch a different failure mode, and the four-way split (process / machine / operator / overall) is the standard taxonomy [S5].
Scheduling bottleneck vs size bottleneck
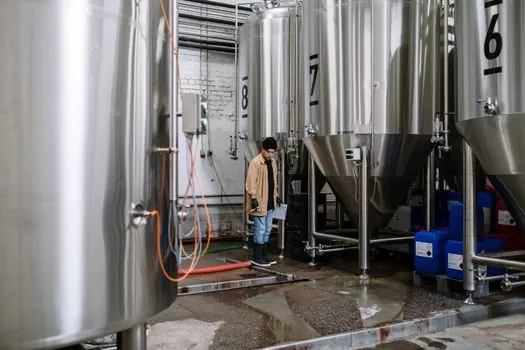
SuperPro Designer splits the analysis cleanly: time (scheduling) bottlenecks cap batches per year, size bottlenecks cap batch size, and the overall plant bottleneck is whichever of the two is tighter, which is almost always the time bottleneck on a properly designed line [S4]. On the time side, the equipment with the longest single-unit operation defines the minimum Recipe (Plant) Cycle Time; on the size side, the vessel with the highest "Liquid Volume / Max Liquid Volume" ratio defines the maximum batch size, and that vessel is the "Size Bottleneck" [S4].
Concretely, if a blow tank rated 10,000 L is paired with a downstream reactor that can only accept 8,000 L per cycle, the reactor is the size bottleneck, and any tank expansion above 8,000 L is dead capital until the reactor is upsized or duplicated [S4]. Conversely, if the blow tank discharges in 18 min but the next unit operation (e.g., a heated soak or transfer pump) takes 42 min, that downstream unit is the scheduling bottleneck, and paralleling the blow tank alone will not move the plant cycle time [S4].
Worked calculation: cutting 10 minutes from a 144-minute cycle
Seeq's published chemical-batch benchmark gives a clean worked example: 10 batches/day at 2.4 h (144 min) per batch is 3,640 batches/year, and a 10-minute cycle reduction moves the line to 10.7 batches/day, or 3,912 batches/year, a gain of about 272 batches/year on the same assets [S1]. At the same source's stated $20,000–$50,000 per batch, that is a $5.4M–$13.6M/year swing on a process change that did not require a new vessel [S1].
Run the same math for a typical blow tank: 144 min cycle × 10 batches/day = 1,440 min/day of plant time, and the blow tank alone is, say, 18 min of that 144 min, or 12.5%. A 10-minute global cut is therefore not coming from the blow tank in isolation; it has to come from a phase-level reduction (charge, dwell, transfer, discharge) tracked per batch, which is why phase-level monitoring, not per-unit cycle time, is the right resolution for a tank-driven line [S1][S3].
Continuous-process cycle time vs batch cycle time

In a continuous line producing 100 units per 40-hour week, throughput is 1 unit per 0.4 h and cycle time is 24 min per unit, and the formula is the same 1/Throughput Rate, with "unit" meaning a finished part, not a batch [S2]. A blow tank sits in the awkward middle: upstream is usually batch (charge, dwell), and downstream is often continuous (transfer to a running reactor or extruder), so the engineer has to report two cycle times, one in minutes per batch for the tank itself, and one in minutes per unit for the downstream line, and not confuse them in the OEE dashboard [S2][S6].
The hidden trap is non-value-adding time: storage, inspection, and rework all sit inside the "Production Lead Time" but outside the "Value-Creating Time," and they are exactly where phase-level monitoring pays back the fastest on a blow tank loop [S3]. Lean convention puts Value-Creating Time < Cycle Time < Production Lead Time, which is the ordering you should see in a phase waterfall chart for any tank-driven batch skid [S3].
Failure modes that invalidate the simple math
Three failure modes routinely break the clean formulas above. First, resource bottlenecks (CIP skids, utilities, labor, raw-material delivery) can cap batches/year even when equipment utilization looks fine on a Gantt, and these are invisible to a tank-only cycle-time study [S4]. Second, sharing of one piece of equipment by two unit procedures inside the same batch, very common on a single blow tank feeding two reactors, double-counts the tank in the equipment utilization chart and inflates the apparent Plant Cycle Time until the sharing is broken by a second vessel [S4].
Third, changeover time that does not amortize with batch size, typical of a tank that has to be fully drained, steamed, and re-inerted between campaigns, will dominate the Effective Machine Cycle Time at small lot sizes, and pushing the lot size up will not save the cycle [S3]. For an IBC tank charged by a shared header, the changeover term is usually negligible, but for a fixed blow tank with a dedicated vent and instrumentation, it is not, and that needs to be in the spreadsheet before anyone quotes a "batches-per-year" number to procurement [S3][S4].
Selection criteria: how to pick the right cycle-time metric to report
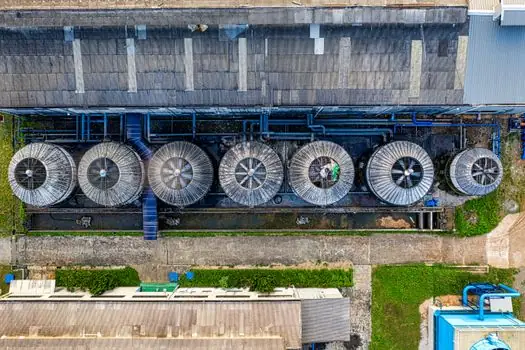
Report four numbers, not one: Recipe (Plant) Cycle Time in minutes per batch, Effective Machine Cycle Time for the blow tank itself in seconds per cycle, batches-per-year, and a phase-level waterfall that shows charge, dwell, transfer, and discharge as separate bars [S3][S4]. The comparison a specifier actually needs is shown below, distilled from the sources.
Option A (tank-only cycle time, minutes per batch): simple, matches ERP batch records, but hides phase-level waste; fits greenfield single-vessel skids [S1]. Option B (effective machine cycle time, seconds per cycle): includes changeover amortization, fits discrete-parts thinking, often wrong for batch [S3]. Option C (plant cycle time + size bottleneck, both): the only option that supports a real capacity decision, and the one SuperPro's debottlenecking workflow is built around [S4]. Option D (phase-level waterfall, minutes per phase per batch): the highest-resolution view, the one that actually lets you identify which 10 minutes to cut, and the one the Seeq benchmark credits with the $5.4M–$13.6M/year swing [S1].
Trackable signals to watch in the next cycle
Two trackable signals for the next planning window: (1) phase-level duration drift on the blow-tank discharge step, where a 2-3% rise in discharge time is usually the first sign of valve or vent-line fouling, and (2) size-bottleneck fill ratio on the downstream reactor, which should sit between 80-90% of max allowable liquid level; below 80% the tank is over-sized, above 90% you are one batch away from a size-bottleneck transfer [S4]. For a related read on tank-farm spot sensing, see 8-Channel Temperature Transmitters for Tank Farm Spot Sensing, and for material-flow context on bulk-handling pinch points, see Belt vs Chain Bucket Elevator: Spec-Based Selection Guide.
Component reference pages worth checking: time relay.