
Continuous busbar and circuit breaker contact temperature monitoring has moved from optional add-on to standard practice in medium-voltage switchgear, with published 2026 references citing fiber optic, infrared, and wireless triaxial vibration sensors covering the same hotspot failure modes from different angles [S1][S3][S4].
Busbars carry the full switchboard current through rigid copper or aluminum conductors, and a single loose joint at a circuit breaker stab terminal or cable termination can drive localized resistance high enough to escalate from a 40-50 °C normal surface reading into the 70-80 °C elevated range that field studies flag as an arc flash precursor [S8]. Real-time online monitoring, not periodic infrared scans, is the only way to catch that drift between maintenance windows.
Where Failures Actually Start: Joints, Stab Terminals, and Cable Lugs
A busbar itself rarely fails; the failure surface is almost always the joint, and published field data from airport switchgear inspections shows the spread: busbar connections running 42 °C normal, circuit breaker contacts at 38 °C, cable terminations elevated at 74 °C, and fuse holders at 39 °C [S8]. That 36 °C delta between the worst joint and the best busbar segment in the same panel is exactly the kind of drift online monitoring is built to catch.
The mechanical drivers are consistent across references: loose or improperly torqued connections, oxidation and corrosion, mechanical stress and vibration, aging insulation, and uneven current distribution all raise joint resistance, and rising resistance generates localized heating long before visible damage appears [S3]. In switchgear specifically, the medium-voltage main busbar sits at 6-36 kV interconnecting incoming feeders to outgoing breaker panels, and a fault on that single busbar takes every downstream circuit with it [S4]. The reliability scope of any condition monitoring system tied to switchgear has to start there.
Sensor Technologies Side by Side: Fiber Optic, Infrared, and Wireless
Three sensing families dominate published 2026 busbar monitoring references, and the choice is driven by voltage class, retrofit constraints, and budget rather than accuracy alone. Fluorescence fiber optic temperature sensors give complete EMI immunity and galvanic isolation, the only metallic-free option that survives direct mounting on live medium-voltage conductors, with one manufacturer claiming a standard deviation of ±0.2 °C and a five-component architecture of demodulator, probes, fiber, display, and software [S1][S4].
Infrared non-contact sensors, typified by the PyroMiniBus line, read emitted thermal radiation from a safe standoff with 125 ms typical response and adjustable emissivity from 0.2 to 1.0; optics options of 2:1 wide-angle, 20:1 general-purpose, and close-focus cover everything from large busbar faces to narrowly spaced conductors [S3]. Wireless triaxial vibration and temperature nodes from a different vendor add 2.5 kHz vibration bandwidth and 150 m open-field range, useful where cable runs back to a gateway are impractical [S2]. The decision matrix looks like this: pick fiber optic when the conductor is permanently energized at medium voltage and EMI is unavoidable; pick infrared when the busbar is in low-voltage MCCs, the panel can be opened for sensor aiming, and bare copper reflectivity is managed with matte paint or heat-shrink; pick wireless triaxial when the goal is fleet-level screening and the panel layout blocks wired sensor runs. The relative trade-offs across these families feed directly into broader vibration condition monitoring programs where mechanical looseness already shows up on accelerometers before it shows up as heat.
What a Complete Breaker and Busbar Monitoring Stack Actually Measures
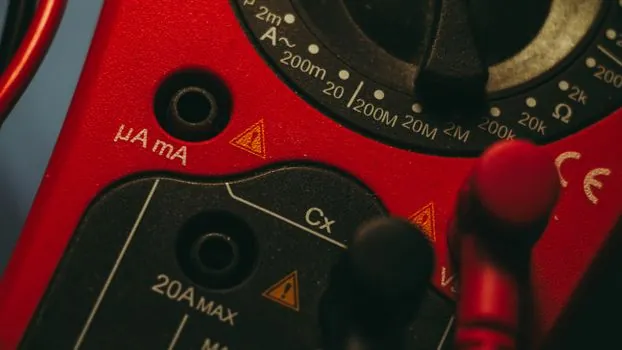
A busbar monitoring system tracks temperature, current, partial discharge, and sometimes vibration at high-current nodes, with the goal of flagging abnormal thermal patterns against configurable thresholds rather than just logging numbers [S6]. For the breaker itself, the monitoring perimeter is wider: stored energy system health, trip coil current, gas pressure, temperature, dewpoint, and high-speed waveform capture on every operation, with the Breaker Performance Monitor class of device overlaying each new trip against a first-trip baseline to surface latch, bearing, and auxiliary contact degradation before a fail-to-open event [S5].
The failure modes a complete stack must cover include mechanical inactivity, stagnant lubricants, sticking mechanisms, seal degradation, wear, fatigue, misalignment, and contact surface corrosion, all of which sit upstream of the thermal signature that busbar sensors would eventually see [S5]. For medium-voltage gear specifically, Hot Spot Monitor-style fiber modules are now published as a continuous thermal monitoring layer, identifying potential failure points and alarming before a hot spot becomes an arc flash [S7]. That thermal layer is also where the broader power monitoring system category overlaps with checking and testing apparatus used during commissioning.
Who Continuous Busbar Monitoring Is For, and Where It Is Overkill
Continuous online monitoring pays back in any installation where a busbar fault takes a critical load offline: data centers, hospitals, airports, water treatment plants, railway substations, and any process line where an unplanned outage triggers a safety or environmental incident [S1][S4][S8]. It is the right call for medium-voltage switchgear at 6-36 kV where the busbar feeds an entire switchboard section, and for low-voltage main distribution boards serving motor control centers and final sub-circuits [S4].
It is overkill for a small lighting panel feeding office loads, for any busway section that is already protected by upstream breakers with no critical downstream process, or for temporary construction power where the equipment will be replaced before joint loosening becomes a concern. The cost calculus also shifts when the alternative is a quarterly handheld IR survey on a de-energized panel; if the load profile is stable and the joints were torqued to spec at install, the marginal benefit of continuous monitoring over periodic thermography is smaller. For applications where the panel layout already drives a predictive maintenance workflow with automatic alarm routing, see how that pattern generalizes in automatic downtime reason detection deployments.
Real Use Cases and 2026 Field Numbers
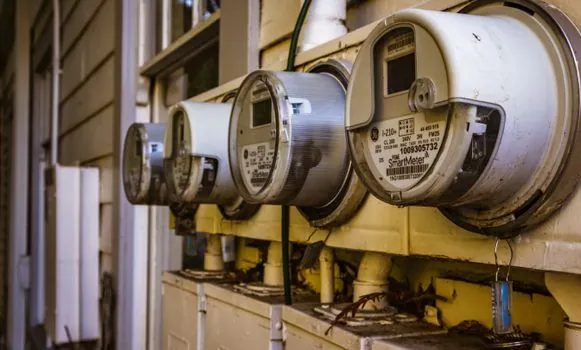
An airport electrical thermal monitoring deployment published in 2026 shows the value of continuous tracking: busbar connections at 42 °C (normal), circuit breaker contacts at 38 °C (normal), cable terminations at 74 °C (elevated), and fuse holders at 39 °C (normal) in the same inspection snapshot, with the elevated cable termination flagged before it reached a failure threshold [S8]. Medium-voltage switchgear Hot Spot Monitor installations are documented as the reliability layer for identifying potential failure points on electrical equipment, with continuous fiber optic reading rather than scheduled walkdowns [S7].
For high-voltage breakers, condition-based monitoring of the stored energy system, gas density, and trip coil allows the operator to detect incipient failures before the breaker is called on to operate, and waveform overlays let the asset owner compare each operation against first-trip baseline to see latch and bearing wear trends as they develop [S5]. The structural similarity to other reliability programs is intentional; the same sensor fusion logic that drives construction machinery and equipment health monitoring is now appearing in switchgear retrofit kits. Continuous bus bar temperature monitoring is, in the published framing, proven to prevent arc flash events, eliminate unplanned power outages, and reduce maintenance costs across industrial and utility infrastructure [S4].
Known Limitations and Failure Modes of the Monitoring Stack Itself
Every sensing family has a failure mode the spec sheet does not lead with. Infrared sensors reading bare copper can be skewed by reflected ambient radiation, and field practice is to apply matte paint, heat-resistant coating, or heat-shrink tubing at the measurement point to lock down emissivity [S3]. Fiber optic fluorescence sensors are non-conductive and dielectric, which is the whole point, but the demodulator and display module are still copper-powered and still need a clean signal path; the published five-component architecture only works if all five are specified together [S4].
Wireless triaxial nodes are limited to 150 m open-field range, and that figure degrades sharply inside metal-enclosed switchgear cabinets, so gateway placement has to be planned during the panel layout, not retrofitted after install [S2]. For breakers, a Breaker Performance Monitor only delivers value if a first-trip baseline is captured at commissioning; without that reference waveform, the overlay feature that surfaces degradation is useless [S5]. Across all three families, the sensors do not fail safe on their own; alarm thresholds and escalation paths have to be configured against actual load profile, or the monitoring system will either page on every load swing or stay silent through a real drift event [S1][S6].
Standards, Sourcing, and What to Verify Before Specifying
No single IEC or ISO standard governs busbar temperature monitoring as a product category, so the engineering basis is built from switchgear standards (IEC 62271 for high-voltage switchgear, IEC 61439 for low-voltage assemblies) layered with the monitoring system's own safety certifications. Fiber optic sensors are typically specified as dielectric and non-conductive, a property that lets them sit directly on energized medium-voltage conductors without creeping or clearance penalties; this is the EMI immunity and galvanic isolation claim repeated across manufacturers [S1][S4]. Infrared sensors should publish a calibrated emissivity range, response time, and optics ratio, with 125 ms response and 0.2-1.0 emissivity adjustment being the published benchmarks for one industrial line [S3]. Wireless nodes should publish open-field range and on-metal range separately, with 2.5 kHz triaxial vibration bandwidth and 150 m open-field being the published reference numbers [S2].
For a specifier, the verification checklist before any busbar monitoring award is: confirm dielectric rating matches the switchgear voltage class, confirm the published accuracy figure (a standard deviation of ±0.2 °C is achievable but must be in the datasheet, not marketing copy), confirm the gateway and demodulator have a documented MTBF, and confirm the alarm thresholds are field-tunable against load profile [S1][S4].