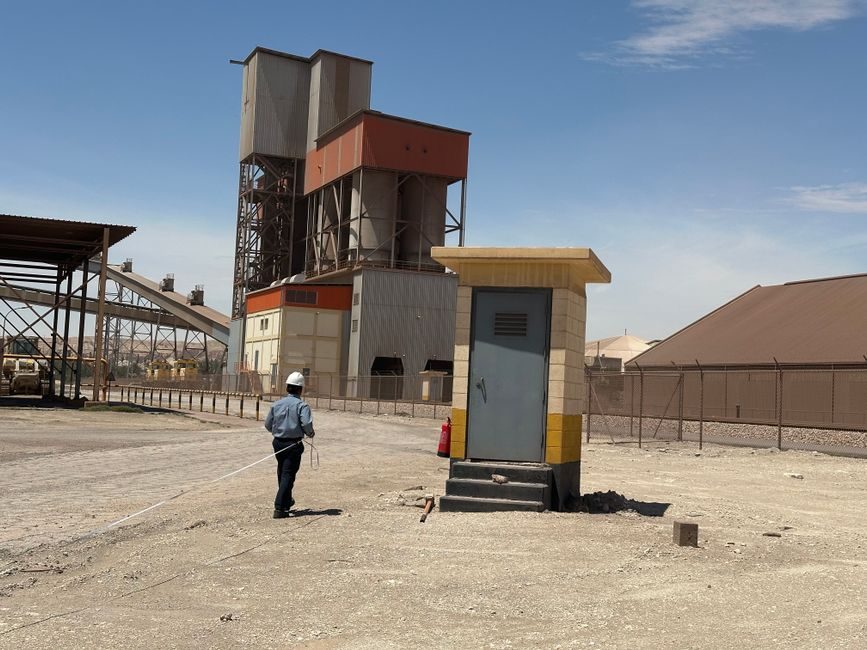
Concrete batching plant total cost of ownership is dominated by 5 cost drivers: plant class (stationary/mobile/compact), output class (45-180 m³/h), energy source, automation tier, and admixture program, with mobile units trading a lower acquisition price against higher per-m³ wear [S2][S8].
On a 15-25 year service life, the acquisition line item typically falls to 20-35% of TCO, while energy, spares, and downtime absorb the balance [S3]. A TCO model that only carries the purchase price systematically under-specs mobile plants and over-specs compact plants in the wrong direction [S3].
What TCO Means for a Concrete Batching Plant
Total cost of ownership is the sum of direct and indirect costs across the full ownership window — acquisition, installation, operation, maintenance, and disposal — not the delivered price on the invoice [S3]. Popularised by Gartner and now standard in supply-chain cost management, TCO exposes hidden lifecycle costs that a purchase-order comparison cannot [S3][S7].
For a concrete batching plant the lifecycle splits into 5 buckets: capital (equipment + civil + electrification), commissioning and training, energy and consumables, planned and unplanned maintenance, and residual / decommissioning value. A US Postal Service procurement reference frames the same 5-bucket structure, grouping them as purchase, use, maintenance, support, and disposal [S4].
Two budget traps repeat on batching-plant projects: under-funding the foundation and electrification line for stationary units, and under-funding wear-part replacement and truck-cycle logistics for mobile units. Both bias the apparent IRR and distort the bid [S1][S2].
Plant Class Comparison: Stationary vs Mobile vs Compact
Stationary plants target 135 m³/h continuous output, run on a permanent foundation, and carry the longest service life (20+ years) with the lowest per-m³ wear cost when utilisation is high [S2]. Mobile plants target 100 m³/h, ship on standard trailers, need no foundation concrete, and trade higher per-m³ wear for relocation flexibility [S2].
Compact plants sit in the middle on capacity, fit inside ISO containers for low-cost sea/land freight, and target tight urban sites where stationary footprints are not feasible [S2]. Selecting among them is fundamentally a utilisation-and-location decision, not a feature checklist.
Decision criteria applied to a typical mid-range project: | Criterion | Stationary | Mobile | Compact | |---|---|---|---| | Foundation required | Yes (engineered) | No (flat surface) | Minimal | | Output (m³/h) | up to ~135 | up to ~100 | mid-range | | Relocation cost | High (dismantle) | Low (truck) | Low (container) | | Best utilisation profile | 1 site, 20+ yr | multi-site, short | urban, narrow | | Per-m³ wear | Lowest | Highest | Mid |
The companion breakdown of concrete batching plant types maps these criteria to specific model codes (HZS60, HZS75, HZS180) and their stated outputs of 45-60, 60-75, and 150-180 m³/h respectively [S8].
Cost Drivers Inside the Acquisition Line
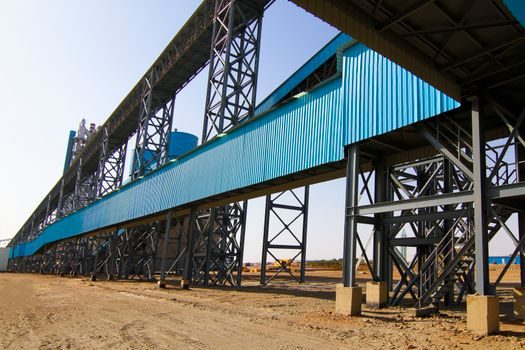
Acquisition is the most visible line and the most commonly mis-quoted. A plant model with stated 60-75 m³/h output, JS1500 mixer, 4.1 m discharge height, 80 mm max aggregate, 165 kW total power, and 200 t/h belt deliver rating sits in a different cost tier than a 45-60 m³/h JS1000 unit at 130 kW, even when both ship from the same factory [S8].
5 spec features move the price of any one model class: mixer shaft count and capacity (single-shaft vs twin-shaft JS vs planetary), aggregate bin count (3 vs 4 bins), silo volume, control system tier (manual / semi-auto / full PLC with batching software), and dust / water-recycling auxiliaries. A twin-shaft JS3000 mixer paired with a 4-bin aggregate section and full PLC is the upper bound of the mid class [S2][S8].
For stationary builds, civil works — foundation design, aggregate stockpile paving, drainage, and grid connection — typically run 15-30% of the equipment price, and they are the line most often missed in early budgets. A structured site prep, foundation, and commissioning map is the cheapest defence against that gap.
Operating Cost: Energy, Admixtures, and the Hidden m³ Variable
Operating cost is the largest TCO bucket on a high-utilisation plant, and the only one that scales with concrete output. A 130 kW total-power HZS60 unit and a 165 kW HZS75 unit both consume near-rated draw under load; the HZS180 class jumps to multi-mixer drive packages in the 200+ kW band [S8].
Admixture dosage is the second hidden driver. A plant that does not meter concrete admixtures precisely over-uses plasticiser and retarder by 3-8% versus a metered system, and that delta compounds across a 15-year life. Choosing a PLC with closed-loop moisture and admixture control is the single highest-NPV retrofit on most retrofits [S1].
Three operational levers repeatedly dominate a batching-plant TCO model: load factor (running at 70%+ of nameplate output vs idling), mix-changeover time (cold plant restarts vs continuous batching), and admixture metering accuracy. Every 1% over-dosage across a 50,000 m³/yr plant is a measurable five-figure annual line item.
Maintenance, Spares, and Wear Geometry
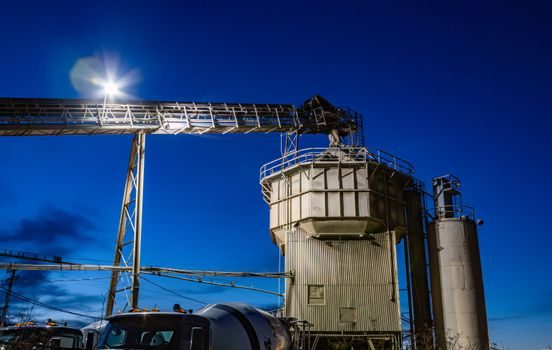
Maintenance on a batching plant is wear-driven and predictable. Mixer paddles, liner plates, conveyor belts, silo filters, and screw conveyor blades are the consumable set, and the replacement interval is set by hours-run and aggregate abrasiveness, not calendar time [S2].
Mobile plants accelerate this curve because they accept more aggressive aggregate handling and run more short-batch cycles. A 100 m³/h mobile plant with 3-4 bin aggregate configuration shows liner life roughly 60-75% of an equivalent stationary unit operating on the same mix design [S2][S8].
Steel and concrete fiber reinforcement dosing adds another wear line: fiber shot adds paddle and discharge gate wear on the mixer and forces more frequent inspections on the aggregate feed. Sourcing fiber through the same PLC-driven metering path is the simplest way to keep wear variance inside the spares budget.
Standards, Compliance, and Sourcing Discipline
Specifying a batching plant against published output, power, and discharge data — the kind carried in vendor spec sheets (e.g. HZS60 45-60 m³/h, JS1000, 130 kW; HZS75 60-75 m³/h, JS1500, 165 kW; HZS180 150-180 m³/h, JS3000) — is the fastest way to align acquisition and TCO models [S8].
Compliance items that frequently miss the bid: dust collection sizing for cement silos, recycled-water settling capacity, noise limits at urban sites, and operator certification for PLC-controlled batches. Each of these has a written cost and a written lead time, and both belong in the TCO table from the first revision [S1].
Used-plant sourcing is a legitimate cost lever when utilisation is short-cycle. A 2018 Erie MG-12CP sold through dealers with batching consulting support is a realistic reference point for entry cost, but the TCO model must still carry the same maintenance, energy, and admixture buckets as a new unit [S6].
End-of-Life, Residual Value, and Decision Signals
End-of-life value is the easiest bucket to omit and the one most likely to swing the TCO verdict on a stationary plant. A well-maintained stationary plant on its original foundation retains 25-40% of acquisition value at year 15; a mobile plant of the same vintage typically retains 15-25%, weighted by relocation count [S3].
For a procurement office running a TCO model, three signals warrant tracking through 2026: the floor on mobile-plant acquisition prices in the 60-100 m³/h band, the lead time on JS-series twin-shaft mixers from primary Asian factories, and the quoted kW-per-m³/h envelope of new compact plants — all three reset every 6-12 months and any of them can flip a borderline project from approval to rejection. Independent of the specific project, the TCO model should be re-baselined against current spec-sheet values before any purchase order is signed.