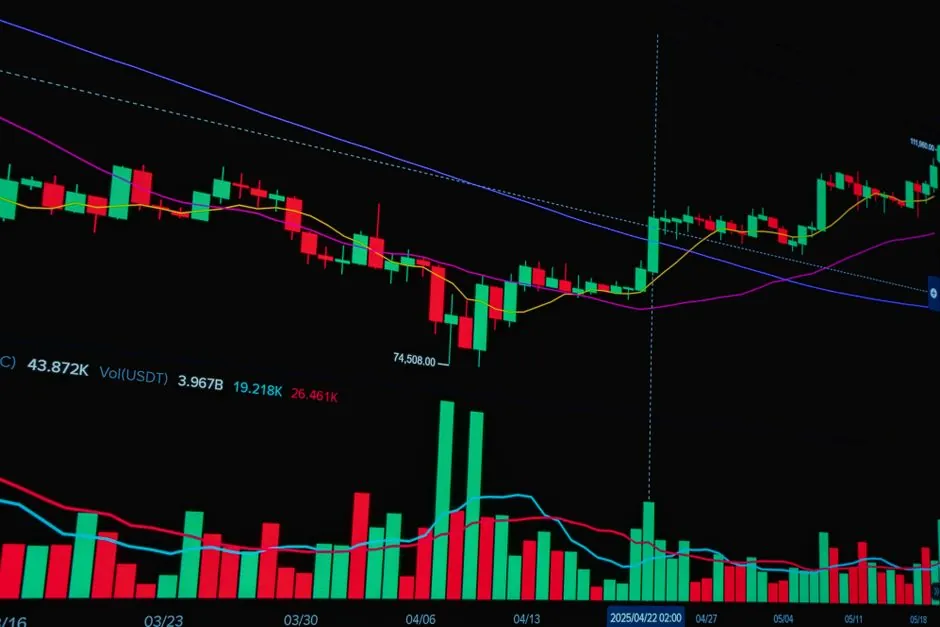
LME three-month copper set a fresh all-time high of USD 14,533 per metric ton on 7 September 2026, with the same session settling 0.9% higher at USD 14,510/t [S8], confirming the 2026 rally has not stalled into Q3.
Year-to-date copper had cleared USD 13,000/t on 5 January 2026 for the first time in history, reached almost USD 13,300/t on 6 January, and briefly traded above USD 14,500/t intraday during the same month [S1][S4][S5]. Goldman Sachs Research has been blunt about the gap to fundamentals: analyst Eoin Dinsmore writes, "We do not expect the price above $13,000 to be sustained" [S2].
Where the price actually sits: intraday records versus forecast averages
The 2026 price ladder is steep at the top and modest in the middle. Benchmark three-month LME copper hit USD 14,533/t on 7 September 2026 [S8], and as of 10 September was approaching USD 15,000/t [S4]. That is roughly 16% above the early-December 2025 level, and almost 50% above 2025's multi-year high printed earlier in the year [S4].
Forecast averages for 2026 sit well below the spot tape, which is the heart of the "record-high but not lasting" narrative. TradingKey projects a 2026 average near USD 12,075/t with a high around USD 12,500/t [S6]; a JP Morgan-sourced compilation has 2026 averaging around USD 11,000/t [S7]; GS Research models a path back below the USD 13,000/t level once the US tariff decision lands [S2]. The disconnect between tape (USD 14,500/t+) and consensus (USD 11,000-12,500/t) is itself a tradable signal, and it explains why speculative length is at record highs even as fundamentals lean surplus [S2].
What is actually pushing the price: tariffs, AI data centers, and physical tightness
Three drivers, in order of tape impact. First, anticipatory US stockpiling ahead of an expected US tariff on refined copper. GS Research models a 15% Section 232-style tariff to be announced by mid-2026, with buyers pulling metal aggressively into US warehouses in late 2025 and early 2026 [S2]. LME warrants leaving warehouse rose materially in December 2025, confirming physical tightness outside the US even as US-bonded stocks built [S2].
Second, demand narrative. AI data-center build-outs are pulling copper into cooling loops, busbars, transformers, and power distribution; the IEA flags the smelter side of the equation, noting that record prices coexist with strategic pressure on smelter margins [S1]. Third, the macro overlay. Risk assets rallied into January 2026 on a "run it hot" US-policy narrative, and copper participated; the US still only accounts for about 7% of global copper demand, so any US-driven demand pickup is incremental, not transformational [S2]. For a spec-side view of where this metal ends up, the copper material reference page covers grade selection, conductivity, and form factors (rod, bar, busbar, tube) that data-center and industrial valve buyers are now pricing in.
The supply side: 600 kt surplus in 2025, 300 kt still expected in 2026

The fundamental story contradicts the tape. The global copper market recorded a 600 kilotonne surplus in 2025, the largest absolute surplus since 2009, and inventories outside the US have continued to rise into 2026 despite the US stockpiling pull [S2]. GS Research raised its 2026 global surplus forecast to 300 kt from a prior 160 kt, on the back of high-price demand destruction and an expected lift in scrap supply [S2]. The IEA flags that smelters are absorbing the strategic pressure: record cathode prices are not translating into record smelter treatment-and-refining charges [S1].
China is the swing factor. GS Research notes Chinese refined-copper consumption has weakened materially, and the pullback is more acute than the 2024 episode that ended in a "China buyers strike" [S2]. If Chinese buyers repeat that 2024 pattern, the surplus resolution is faster and the downside on price is larger once the tariff overhang clears.
Tariff decision as the binary catalyst: mid-2026 announcement versus 2027 delay
GS Research frames the next move as a binary policy event. Their base case is a definitive 15% refined-copper tariff announced by mid-2026, which ends US stockpiling and lets global surplus weigh on the LME price [S2]. A delay to 2027 is the bearish alternative: probability of a tariff falls, focus shifts back to the well-supplied ex-US market, and the speculative premium unwinds [S2].
Recent US policy already hints at a softer tariff posture. The Critical Minerals Section 232 decision suggests the Trump Administration is no longer relying solely on tariffs to lock in metals security of supply, which is a soft bearish signal for the LME tape but bullish for ex-US smelter economics [S2]. For specifiers, the operational read-through is straightforward: short-cycle copper purchase orders (busbar, pressure transmitter sensing lines, flow meter coils) should be timed against tariff-decision windows, not against the spot print.
What this means for buyers: price drivers, total cost, and timing
For procurement, the cost stack now has three moving parts. First, metal price: LME copper has averaged well above 2024-2025 levels, with a 2026 high near USD 14,533/t [S8]. Second, processing and fabrication: smelter TC/RCs are under pressure, so the cathode-to-semis conversion margin is widening, which lifts the price of drawn copper products, PLC wiring, and magnet wire above the LME move alone [S1]. Third, freight and tariff layering: US-destined orders carry a tariff premium on top of LME, while ex-US orders face a smaller but rising premium as the surplus outside the US gets absorbed by the stockpiling draw.
Total cost of ownership favors locking now for tariff-exposed US projects, and waiting for the post-decision window for ex-US projects. A useful analogue is the spec side: buyers comparing pressure sensor platforms against data-center cooling demand are running the same exercise, weighing spot hardware cost against a 12-month supply-and-tariff overlay, not a single purchase order. The 2026 copper tape is a magnified version of that exercise at commodity scale.
Limits to the rally: positioning, demand elasticity, and China
Speculative positioning on the CME is at a record absolute high, but long positions as a share of total open interest are not at prior speculative-peak extremes, so the unwind, if it comes, will be sharp but not necessarily instant [S2]. High prices are feeding back into demand: scrap supply rises as cable, transformer, and motor recyclers release metal into a strong market, easing the concentrate-and-refined tightness that helped the rally start [S2].
Two verifiable signals to watch into Q4 2026: (1) the LME ex-US visible inventory print, which GS expects to keep rising into a tariff decision and which is the cleanest read on whether the surplus is being absorbed, and (2) the Chinese refined-copper apparent demand series, where a repeat of the 2024 buyers-strike pattern would mark the top. Until both break, the LME tape can stay pinned above USD 14,000/t, but the consensus forecast is unambiguous: the price above USD 13,000/t is not expected to hold [S2].
Background reading: Steel Safety Fence Panel Weight per m²: Handling Spec Notes.