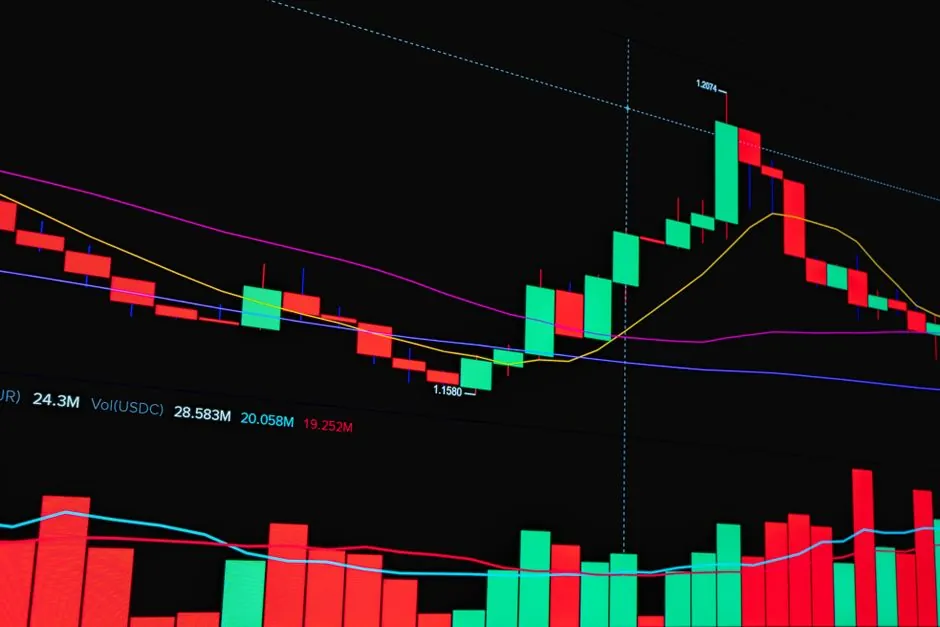
Data center chillers are entering a USD 5.23B 2026 baseline market, with seven independent forecasts putting the 2026-2035 compound annual growth rate between 8.26% and 8.90% and the addressable market between USD 11.26B and USD 13.89B by 2035 [S1][S2].
Hyperscale and colocation operators drive nearly all incremental unit volume, while above 2,000 kW water-cooled and adiabatic units are absorbing the AI rack-density surge; air-cooled units still lead installed base at 45% of 2025 shipments, but liquid-compatible systems are the structural growth lane [S1][S2].
Market Size, CAGR, and Forecast Spread
Precedence Research sizes the 2026 global data center chiller market at USD 5.23B, up from USD 4.80B in 2025, and projects USD 11.26B by 2035 at 8.90% CAGR [S2]. Market Research Future tracks a parallel series, reporting USD 6.278B in 2025 climbing to USD 13.89B by 2035 at 8.26% CAGR [S1]. Stratview Research is the most aggressive on growth rate, citing a 15.8% long-run CAGR to USD 7.1B by 2032 from a 2024 base of USD 2.2B [S4]. The US-only segment, per The Report Cubes, was USD 4.45B in 2025 with a 9.20% CAGR projected through 2034 [S6]. The wider cooling stack, including CRAC, CRAH, and immersion, is sized by MarketsandMarkets at USD 13.23B in 2026 growing to USD 37.62B by 2033 at 16.1% CAGR [S5], with Fortune Business Insights' parallel cooling report starting at USD 21.0B in 2026 toward USD 54.4B by 2034 [S3].
The dispersion in the chiller-only numbers reflects different inclusion scopes: Stratview isolates the chiller hardware line, while MRFR and Precedence bundle services, controls, and modular skids. Engineers comparing vendor revenue claims should pin the forecast's scope before benchmarking growth.
Regional Demand Share and Where Capacity Is Being Built
North America is the dominant 2025 region at 40% of global demand per Precedence [S2] and 44.1% per MarketsandMarkets' cooling-stack measure [S5]. Asia-Pacific is the fastest growing region across every series, with Precedence calling out 11.5% CAGR through 2035 and MRFR noting accelerating buildouts in India, Malaysia, and Indonesia [S1][S2]. The US-specific chiller market was USD 4.45B in 2025 and tracks a 9.20% CAGR through 2034, with Virginia, Texas, Arizona, and Ohio absorbing the largest hyperscale pipelines [S6]. The Report Cubes further notes that secondary US metros, including Quincy (WA), Hillsboro (OR), and Reno (NV), are crossing the 300 MW threshold and now require multi-chiller plants rather than single skid deployments [S6].
For a process engineer, the practical read is that above 2,000 kW water-cooled skids and adiabatic dry coolers are the unit types scaling fastest in this build cycle; see the reference entry on chiller selection and capacity classes for the underlying envelope definitions.
Chiller Type Split: Air-Cooled, Water-Cooled, and Adiabatic
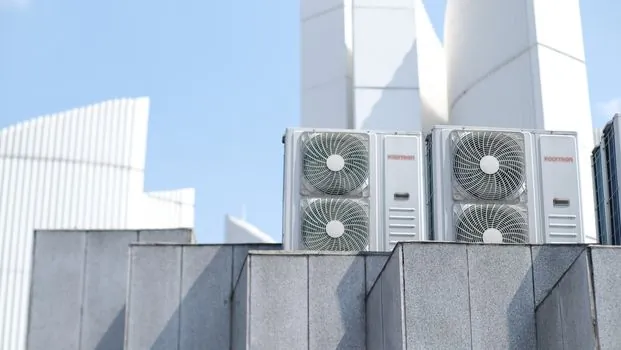
Air-cooled chillers led 2025 shipments with 45% share, but water-cooled units are projected to grow at 9.5% CAGR through 2035, the fastest of the three mechanical categories [S2]. MRFR adds adiabatic chillers as a third class and flags them as the segment most exposed to water-stress regulation in the US Southwest and southern EU [S1]. By compressor technology, screw chillers maintain dominance on proven reliability, scroll units are the fastest growing, and centrifugal remains the workhorse for the above 2,000 kW class [S4]. The 500 to 2,000 kW band, the dominant retrofit bracket for older colocation halls, grows at 7.5% CAGR, while above 2,000 kW units held 45% of 2025 capacity share, weighted by AI training pods [S2].
Three structural constraints keep dictating selection: water availability, ambient wet-bulb, and the operator's tolerance for glycol loops. Where wet-bulb stays under 25°C for 90% of hours, air-cooled with economizers wins on installed cost; above that, water-cooled with cooling towers or adiabatic assist is the lower total-energy option.
End-User Mix: Hyperscale, Colocation, Enterprise, Edge
Hyperscale operators led 2025 with 40% of chiller spend, colocation was the second-largest buyer, and enterprise is now the fastest growing sub-segment per Stratview [S2][S4]. Cloud service providers (CSPs) captured 30% of application-level demand in 2025 and are forecast at 11% CAGR through 2035 as GPU clusters displace general-purpose compute [S2]. Edge data centers, while still a small share, are pulling in compact scroll and modular skid units designed for 20-50 kW per rack, with Munters' July 2024 acquisition of Geoclima explicitly targeting this footprint [S4]. Stratview's recent M&A list also includes Vertiv's 2025 acquisition of PurgeRite for HVAC commissioning and Daikin Applied's 2025 pickup of DDC Solutions to extend its modular high-density line [S4].
The buyer profile shift is operationally meaningful: hyperscale and CSP procurement is on multi-year master supply agreements with locked capacity reservations, mirroring the transformer slot dynamics described in how data center developers reserve transformer production slots in 2026. Colocation operators tend to spec in 6-12 month windows, and enterprise buyers still lead with packaged air-cooled units for capex reasons.
Vendor Map: Who Holds the Capacity and the Service Backlog

The named OEM roster is consistent across all four major reports: Carrier (US), Trane Technologies (IE), Schneider Electric (FR), Johnson Controls (US), Daikin Industries (JP), Mitsubishi Electric (JP), Hitachi (JP), Rittal (DE), and Airedale International (GB) lead the chiller line [S1]. MarketsandMarkets tags Vertiv Group Corp., Johnson Controls, and Schneider Electric as "star players" when the scope is widened to the full cooling stack [S5]. Daikin Applied's 2025 acquisition of DDC Solutions positions it for high-density modular skids; Munters (post-Geoclima) is now a serious challenger in the 1,000-2,000 kW European segment [S4]. Vertiv's HVAC-services expansion via PurgeRite suggests the service-and-controls attach is becoming as margin-rich as the box itself [S4].
For buyers, the practical differentiation is rarely headline efficiency; it is lead time on refrigerant-circuit components, regional service density, and whether the OEM will commit to a 1.2-1.4 PUE on a chilled-water plant at contract signature.
Drivers, Constraints, and Comparison Across Chiller Categories
The demand pull has four named drivers across the research set: AI/HPC rack density, hyperscale and edge buildout, PUE pressure from operators, and stricter refrigerant regulation phasing down high-GWP HFCs [S1][S2][S4]. On the supply side, the binding constraint is not box demand but factory capacity, specifically large-frame centrifugal compressor slots, copper tube bundles, and the skilled labor to factory-accept multi-megawatt skids. The above 2,000 kW water-cooled category has the longest quoted lead time in 2026, with Vertiv and Trane both reporting 14-18 month delivery for fully integrated plants [S4].
A direct comparison for spec writing: air-cooled units win on installed cost and water permit avoidance, water-cooled units win on efficiency and capacity density, and adiabatic units win where water is scarce but electricity is reliable. By cooling capacity class, below 500 kW is the largest unit count but smallest revenue share, 500-2,000 kW is the retrofit sweet spot, and above 2,000 kW carries the steepest pricing premium and the longest backlog [S1][S2].
Selection Criteria for the 2026 Build Cycle

For new AI training halls, the spec baseline in 2026 reads: above 2,000 kW water-cooled centrifugal, N+1 redundancy, primary-secondary chilled-water loop with free-cooling plate-frame heat exchangers, and a target annualized PUE under 1.25 [S4][S5]. For retrofit colocation floors where the load is rising but the building is fixed, 500-2,000 kW air-cooled screw or scroll units with hot-aisle containment are the lower-disruption choice, and they qualify for the fastest permitting path under most US state energy codes [S2]. For edge sites under 1 MW, modular scroll skids with integrated controls dominate, and Geoclima-style packaged units are increasingly competitive against traditional US-domestic packaged chillers [S4].
AI-driven controls are now table stakes, not a differentiator; the 2026 buy decision is increasingly a function of refrigerant GWP, factory lead time, and whether the OEM's service network covers the specific metro. Track the next two signal nodes: MarketsandMarkets' next cooling-stack revision and the 2026 Q4 hyperscale capex guidance from Microsoft, Amazon, and Google, both of which directly translate into above 2,000 kW chiller orders [S3][S5].
Component reference pages worth checking: data logger, and pressure transmitter.