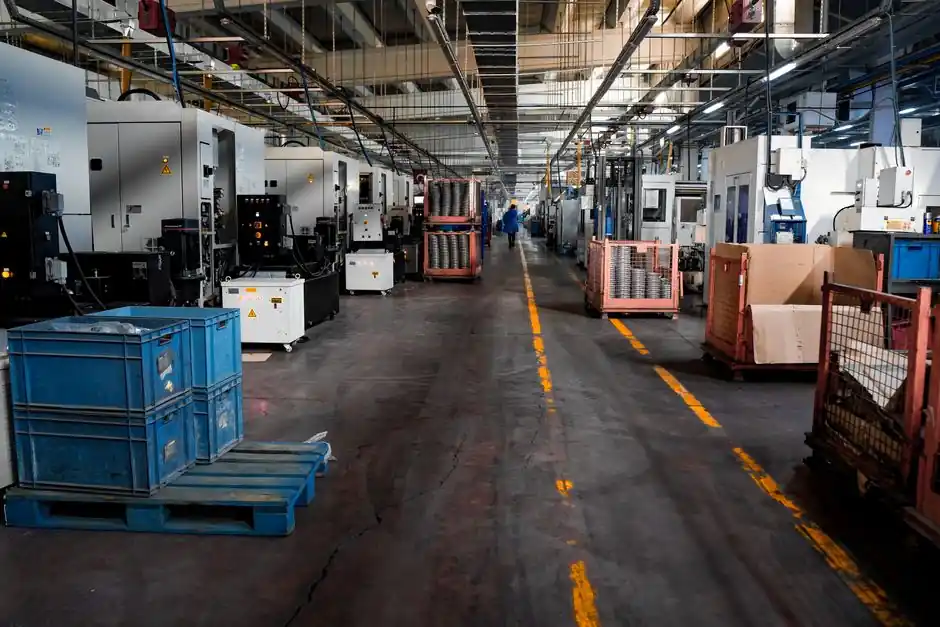
Drone bill-of-materials (BOM) cost is dominated by five subsystems: airframe, propulsion (motors + ESCs + props), flight controller + power distribution, battery pack, and payload/sensor stack, with material cost typically outweighing conversion cost at low volume [S3].
For an industrial multirotor in 2026, these five buckets commonly represent 70 to 90 percent of the factory-gate unit cost before margin, freight, and certification overhead, and a standard-costed BOM inquiry [S3] is the cleanest way to roll up material vs conversion cost across the same build.
Cost driver map: where the money sits in a drone BOM
Frame and structure (CNC-machined or carbon-fiber tubes, gussets, fasteners, vibration isolation) typically absorbs 12 to 22 percent of BOM cost on industrial multirotors, with carbon fiber raising material cost 2 to 4x versus glass-filled nylon but cutting weight 30 to 50 percent [S3].
Propulsion (BLDC motors, electronic speed controllers, propellers) is the second largest bucket, commonly 18 to 28 percent of BOM, and is the line item most sensitive to volume tier: motor unit cost can drop 40 to 60 percent between a 100-unit pilot run and a 5,000-unit production run [S3]. Flight stack (autopilot, IMU, GPS, power distribution board, wiring harness) sits at 8 to 14 percent; the PLC class of deterministic controller that some industrial variants piggyback on for payload hand-off commands is a useful reference for the same deterministic bus + I/O discipline the autopilot already requires.
Cost drivers ranked, qualitative without a sourced price band
Rank 1, battery pack: 20 to 35 percent of BOM, dominated by cell cost (21700/18650 Li-ion or LiPo pouches), BMS hardware, and pack assembly labor; the same cost roll-up logic a NetSuite Costed BOM Inquiry applies to assembly conversion cost [S3] is exactly how pack assemblers separate cell cost from labor.
Rank 2, propulsion (motors + ESCs + props): 18 to 28 percent, with KV rating, stator size, and ESC current rating the three spec knobs that move unit price most. Rank 3, airframe: 12 to 22 percent, driven by material choice (carbon vs glass-filled nylon vs aluminum), machining vs molding, and tolerance class on mounting interfaces. Rank 4, flight stack + harnesses: 8 to 14 percent, where a pressure sensor barometer and an industrial valve style solenoid for payload release are the kind of sub-assemblies that quietly add 2 to 5 percent to material cost on survey-class builds. Rank 5, payload/sensor stack (camera, LiDAR, RTK GNSS, compute): 10 to 25 percent, the widest spread in the BOM, because a $200 mapping camera and a $20,000 LiDAR + RTK payload sit in the same cost line.
Material cost vs conversion cost: reading the standard-costed BOM
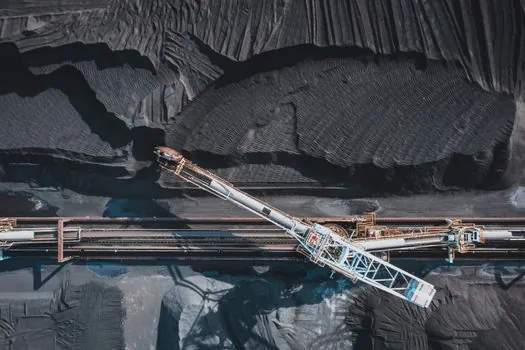
A standard-costed BOM breaks the assembly into component cost (material at standard) plus conversion cost (labor + machine), with the assembly cost calculated as the sum of components plus a routed conversion cost [S3]. For drone buyers, that means the same view that lets a cost accountant explain why an inventory revaluation shifted between periods [S3] also explains why a motor swap or a carbon-vs-aluminum frame change moves the factory quote.
Material cost on a drone BOM is the higher of the two at low volume because labor is amortized across few units; conversion cost becomes a larger share as volume grows past the tooling amortization threshold, which is one reason prototype quotes look expensive on a per-unit basis even when the BOM is identical. Sourcing portals surfaced in July 2026 [S1] explicitly pitch "Full Cost Breakdown: unit costs, MOQs, tooling, and shipping" as a deliverable, which mirrors the BOM + conversion-cost structure described in the NetSuite Costed BOM Inquiry documentation [S3] and is the format most factory-quote platforms now return.
Certification, lead time, and total cost of ownership
Beyond the BOM, three line items move the all-in unit price: type certification (e.g. FAA Part 107 weight class compliance, CE/RED, country-specific radio approval), IP rating work for the airframe and connectors, and quality-control overhead tied to drone manufacturing quality standards, each can add 5 to 15 percent on top of the bare BOM at low volume. [S1]
Lead time drives working capital cost: an 8 to 14 week lead time on carbon-fiber frames, motors, and battery packs is typical in 2026, and that ties up cash in WIP inventory before revenue lands. Total cost of ownership (TCO) for a drone fleet is dominated by battery cycle life (typically 300 to 500 cycles on industrial LiPo, 800 to 1,500 on Li-ion 21700 packs), motor bearing life, and crash/MTBF rates, so a buyer comparing two BOMs at the same factory-gate price should weight a 1.5x-cost carbon frame against a longer MTBF before declaring the cheaper build "lower cost." Industrial drone adoption under Industry 4.0 walks through the same selection gates from the operations side and is a useful cross-check on the TCO math.
Comparison of main airframe materials on cost, weight, and lead time
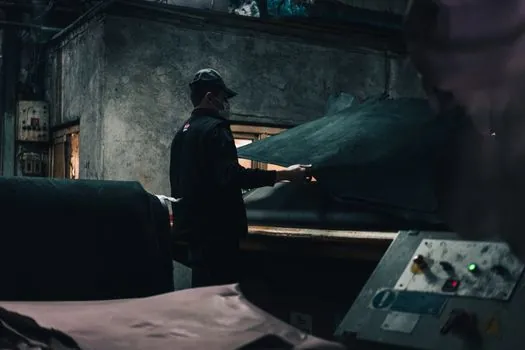
Glass-filled nylon (PA6/PA12, injection molded): lowest material cost, longest tooling lead time (6 to 10 weeks for steel tooling), heaviest per-quad footprint, best for sub-$1,000 toy-class and short-run industrial builds. Carbon fiber tube + CNC plate: 2 to 4x material cost of nylon, 30 to 50 percent lower airframe weight, 2 to 4 week fabrication lead time at Tier-2 machining shops, dominant choice for 2 to 15 kg industrial multirotors. Aluminum (CNC 7075-T6 or cast): 1.5 to 2.5x nylon cost, heavier than carbon but with better impact tolerance and easier field repair, common in defense and heavy-lift variants. The Costed BOM Inquiry view [S3] is exactly the tool a sourcing manager uses to compare those three against the same component-cost + conversion-cost columns before issuing an RFQ.
Limitations and failure modes in the BOM view
Standard-costed BOMs assume stable component pricing [S3], which fails in two real conditions: copper price volatility on motor windings and BMS PCB copper content, where bands have moved sharply into 2026, and cell-level price moves on 21700/18650 Li-ion lines that have not yet been rolled into a standard cost.
Copper demand and price bands through 2030 is the most relevant macro reference for motor, ESC, and harness pricing right now, because the same supply-deficit signal moves every copper-bearing line in a drone BOM at once. The BOM view also hides field-failure cost: a motor batch that passes bench test but fails at 1,000 hours looks identical to one that does not in a costed inquiry [S3], which is why OEM PPAP and traceability data, not the BOM alone, gate an industrial drone decision.
Trackable signals for the next sourcing cycle
Trackable signal 1: cell-level 21700 Li-ion spot price and the BMS IC lead time (currently 6 to 12 weeks at 2026-08), since these are the two battery-bucket drivers most likely to shift before Q4 2026. Trackable signal 2: CNC machine shop capacity in southern China and northern Vietnam, because 2 to 4 week frame lead times stretch to 6 to 8 weeks when capacity tightens, and that delta flows directly into WIP cost. Trackable signal 3: type-certification backlog at the notified body you plan to use, since a 12 to 20 week CE/RED review can sit ahead of a finished BOM and stall the entire cost-rollup to commercial release. [S3]