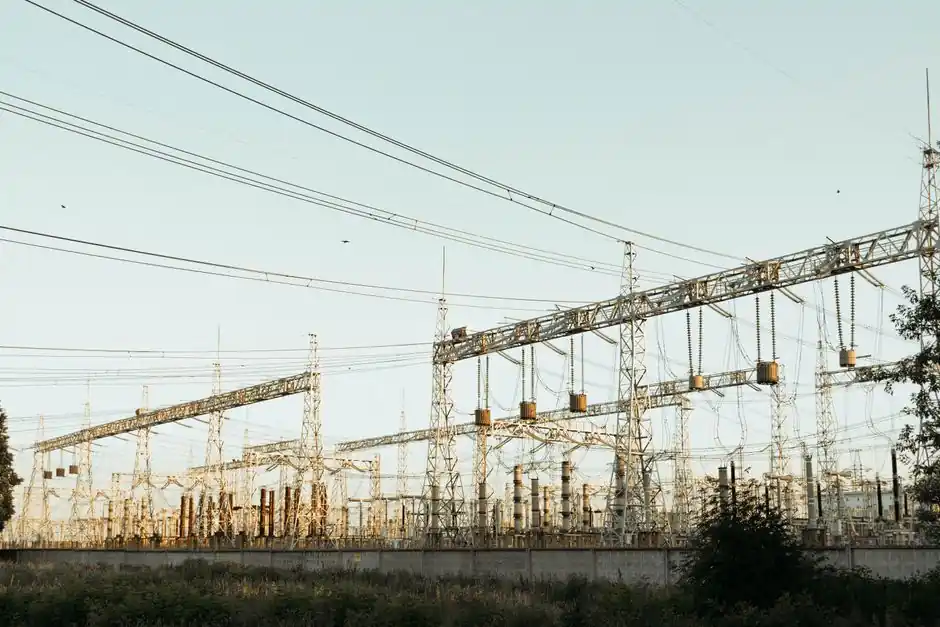
Europe added 36 GWh of new battery energy storage systems (BESS) in 2025, taking operational fleet capacity past 100 GWh for the first time, and is now bracing for annual installations to exceed 50 GWh in 2026 and reach 138 GWh by 2030 under SolarPower Europe's Medium Scenario [S1].
On 23 June 2026, the European Commission aligned storage policy with the AccelerateEU package, setting a 200 GW energy storage target for 2030 and recasting batteries as a strategic asset for resilience, competitiveness, and energy sovereignty rather than a renewable-supporting accessory [S1]. For procurement teams, the operative question is no longer whether to specify BESS capacity but how to align inverter sizing, EMS, and fire-suppression specs with the segment (utility-scale, C&I, residential) that will dominate each region.
Europe 2025-2030: From 100 GWh to 580 GWh Operational
SolarPower Europe's Medium Scenario projects Europe's total installed BESS capacity to grow more than sixfold, from just over 100 GWh at end-2025 to roughly 580 GWh (EU-27 alone: 470 GWh) by 2030, a base case that already falls short of the 200 GW Commission target expressed in power terms [S1]. Utility-scale batteries overtook residential and C&I segments in 2025, accounting for more than half of annual European installations, a structural shift that redefines supplier qualification around EPC scale, grid-interconnection queues, and revenue stacking under ancillary services [S1].
Germany, the UK, and Italy remain the three largest national markets, but their combined share is eroding as Ukraine and Bulgaria each added nearly 3 GWh in 2025 and entered the top five, illustrating geographic diversification that changes the energy management contracting landscape [S1]. Ukraine's inclusion is policy-driven: extensive damage to its generation and transmission infrastructure has converted battery storage from an investment thesis into a documented energy-security asset, a pattern that competing suppliers should expect to replicate in any future grid-disturbance scenario [S1].
United States 2025-2030: 57.6 GWh Added, 600+ GWh by 2030
The U.S. installed a record 57.6 GWh of battery storage in 2025, a 29% year-on-year jump, with utility-scale accounting for 16 GW/50 GWh of that total and behind-the-meter (residential + C&I) contributing 12 GW/8 GWh per Benchmark Mineral Intelligence's February 2026 analysis for SEIA [S3][S4]. By the close of 2025, the U.S. operational fleet stood at 137 GWh utility-scale, 19 GWh C&I, and 9 GWh residential, a three-tier split that mirrors the European utility-heavy pattern and validates a single global procurement framework differentiated by interconnection class [S4].
Benchmark's Q1 2026 outlook calls for 35 GW/70 GWh of new U.S. installations in 2026, split 20.2 GW/62.4 GWh utility-scale and 14.8 GW/7.3 GWh behind-the-meter, with cumulative operational capacity projected to clear 600 GWh by 2030 [S3][S4]. The behind-the-meter share held flat at 13% as residential volumes pulled forward ahead of the Section 25D investment tax credit expiration, a timing artefact that complicates the 2027 baseline read and should be normalised in any multi-year demand model [S4]. SEIA has publicly warned that federal-level narrowing of clean-energy tax credits could compromise grid reliability and power affordability if deployment momentum stalls, a risk factor buyers should weight against bullish headline forecasts [S4].
Global Demand Backdrop: IEA's 3.6% Annual Electricity Growth
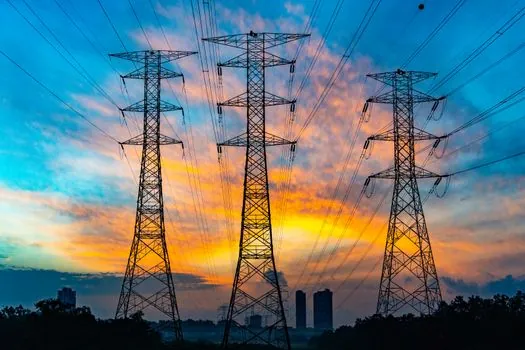
Global electricity demand is forecast to grow at an average 3.6% per year over 2026-2030 in the IEA's Electricity 2026 base case, an unusually brisk rate that mechanically enlarges the addressable market for flexible capacity, including storage and demand response [S5]. The same outlook elevates storage from a renewable-integration bolt-on to a grid-balancing asset comparable to peakers and transmission upgrades, which has direct consequences for energy meter specification at the point of common coupling [S5].
For spec writers, the 3.6% headline figure matters less than the implied hourly flexibility deficit: each additional percentage point of electrification (heat pumps, EVs, electrolysers) raises the evening peak that storage must absorb, and the IEA's framing implies the storage share of new capacity additions must rise materially above the 2025 baseline to avoid curtailment-driven revenue erosion [S5].
Segment Comparison: Utility-Scale vs C&I vs Residential
The three application segments differ on at least four decision criteria that determine supplier and product selection, and a side-by-side read of the data is the most useful way to size them. A structured view: utility-scale projects (50-500 MWh+) drive the European and U.S. volume, dominated by containerised LFP with 2-4 hour duration; C&I sits in the 1-10 MWh band, often paired with on-site solar and behind a single energy management gateway; residential remains a high-unit, low-MWh segment (5-20 kWh per home) with strong pull-forward risk around subsidy cliffs such as the U.S. Section 25D [S1][S4].
Compared on capex intensity, supply-chain concentration, and lead time, the segments rank as follows: utility-scale wins on $/kWh but loses on grid-interconnect queue time (often 3-5 years in congested U.S. ISOs); C&I balances both and increasingly uses standardised storage rack blocks to compress EPC schedules; residential has the shortest lead time but the highest soft-cost share and the most exposure to policy whiplash, as the 2025 U.S. pull-forward demonstrated [S3][S4].
ASEAN: USD 5.43 Billion by 2031

Mordor Intelligence sizes the ASEAN energy storage market at USD 3.67 billion in 2025 and USD 3.91 billion in 2026, expanding to USD 5.43 billion by 2031, a 2026-2031 CAGR implied in the low single digits but compounded across a regional base that includes Indonesia, Vietnam, the Philippines, Thailand, and Malaysia [S7]. The ASEAN growth driver differs from Europe and the U.S.: island and microgrid architectures dominate, diesel-displacement is the primary value proposition, and project sizes cluster in the 10-100 MWh band that overlaps with European C&I standards [S7].
For Chinese and Korean cell suppliers that already ship containerised LFP globally, ASEAN is the highest-growth non-OECD pocket through 2030, and procurement teams should expect lead times to compress as regional integrators (Sungrow, Huawei, Fluence, Wartsila) localise assembly rather than ship finished containers from China [S7].
Policy Anchors and Standards Watch
The European Commission's 200 GW-by-2030 storage target under AccelerateEU is a power-based headline, not an energy (GWh) figure, and reconciling it with SolarPower Europe's 580 GWh Medium-Scenario energy projection is the first reconciliation spec engineers must do when sizing interconnection rights [S1]. Ukrainian deployment under wartime conditions, approximately 3 GWh added in 2025, has been publicly cited by SolarPower Europe as evidence that batteries function as energy-security assets, not just clean-energy assets, a framing that will likely migrate into EU Solidarity-era procurement language [S1].
On the U.S. side, the Section 25D residential tax credit's expiration has already distorted the 2025-2026 install curve, and any buyer modelling 2027-2030 U.S. residential volumes should treat pre-credit-expiry data as a non-repeatable anomaly rather than a trend [S4]. SEIA's February 2026 outlook does not name a specific statutory anchor for the 600 GWh figure, so procurement specifications that need a hard compliance hook should anchor instead to UL 9540 (energy storage system safety) and IEEE 1547 (interconnection) at the equipment level, and to the relevant ISO tariff for revenue stacking at the project level [S4].
Supply-Side Implications for Spec-Driven Buyers
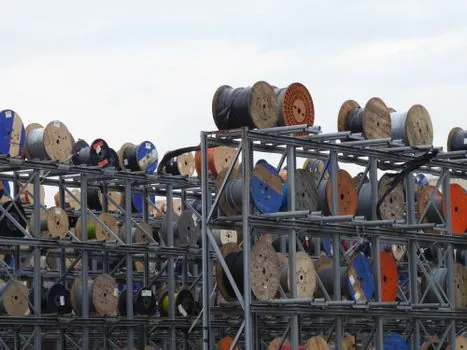
Annual European installations jumping from 36 GWh in 2025 to a projected 50+ GWh in 2026 and 138 GWh in 2030 implies roughly 3-4x growth in containerised LFP demand from European-domiciled integrators, and a parallel uplift in upstream ASRS system and warehousing throughput at cell, module, and pack stages [S1]. The shift of utility-scale to majority share in both Europe and the U.S. means storage handling and storage cage standards at integrator sites should be reviewed against larger-format 20-ft and 40-ft container flows rather than residential pack-by-pack handling [S1][S4].
For spec writers building a 2026-2030 procurement plan, three actionable signals stand out. First, the 600 GWh U.S. figure is a Benchmark Mineral Intelligence view prepared for SEIA, not a regulatory mandate, and should be paired with sensitivity analysis around Section 25D aftermath. Second, the European Medium Scenario is already below the 200 GW Commission target, so capacity under-shoot is the base case and supply tightness, especially in 4-hour duration LFP, is plausible from 2028. Third, ASEAN's USD 3.91 billion 2026 base makes it a credible secondary sourcing region for cells and pre-assembled racks, complementing a related read of energy storage market share 2026 by cell, integrator, and application for supplier shortlisting.