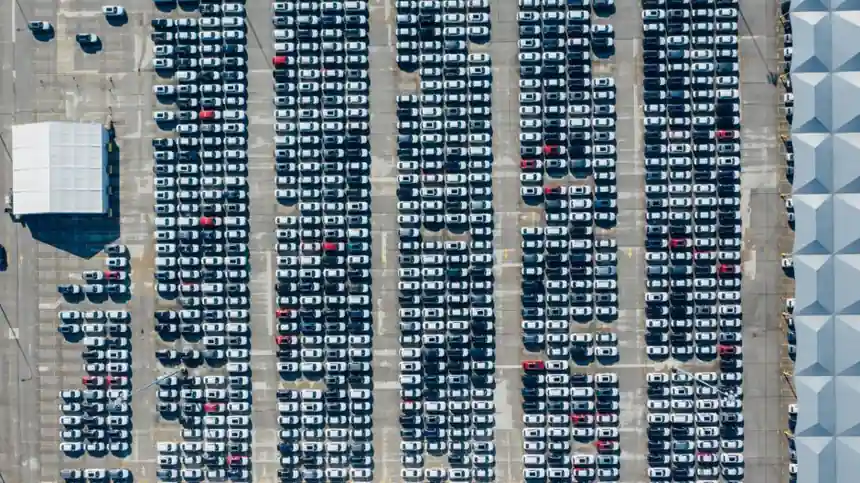
Global EV battery installations reached 1,187 GWh in 2025, a 31.7% year-on-year jump from 901.4 GWh in 2024, with CATL at 39.2% (464.7 GWh) and BYD at 16.4% (194.8 GWh) leading the field per SNE Research data [S1].
The top-10 makers captured 89.4% of the 2025 market, leaving 10.5% (124.9 GWh) to smaller players, and seven of the top ten suppliers globally are headquartered in mainland China [S1].
2025 Full-Year Rankings: CATL's 39% Anchor, BYD's LFP Engine
CATL remained the only supplier worldwide with more than 30% market share in 2025, installing 464.7 GWh versus 342.5 GWh in 2024, a 35.7% year-on-year gain that outpaced the industry average [S1]. BYD/FinDreams followed at 16.4% (194.8 GWh), with LG Energy Solution at 9.2% (108.8 GWh), CALB at 5.3% (62.8 GWh) and Gotion High-tech at 4.5% (53.5 GWh) rounding out the top five [S1].
SK On (3.7%, 44.5 GWh) and Panasonic (3.7%, 44.2 GWh) were effectively tied for sixth, with Eve Energy at 2.6% (31.3 GWh), Samsung SDI at 2.4% (28.9 GWh) and Svolt at 2.4% (28.5 GWh) completing the published top ten [S1]. For context on the scale of a single supplier, the Wikipedia cross-check of 2026 production figures lists CATL at 260 GWh of dedicated EV cell output and BYD/FinDreams at 111 GWh, both still showing above 40% year-on-year growth [S3].
China Domestic Q1 2026: CATL Crosses 50% on an NMC Skew
CATL's domestic China EV battery share reached 50.1% in the first quarter of 2026, the first quarterly reading above 50% in roughly five years, on 81.6% NMC share and 41% LFP share per the China Passenger Car Association [S5]. BYD's domestic share fell to 17.5%, described as its weakest quarterly result in five years, with a 4.3% year-on-year decline, and the company operates exclusively in the LFP segment with 22.6% of that domestic sub-market [S5].
China's January-February 2026 EV battery production hit 310 GWh, a 22% year-on-year increase, but the ratio of produced-to-installed packs dropped to a historical low of 19%, signalling that a large share of output is flowing into inventory rather than vehicles [S5]. The same release shows that, of all the top-ten Chinese suppliers, only CATL and CALB run a meaningful dual NMC + LFP strategy, while the rest concentrate on a single chemistry, most often LFP [S5].
Global January-April 2026: 72% Goes to Seven Chinese Players
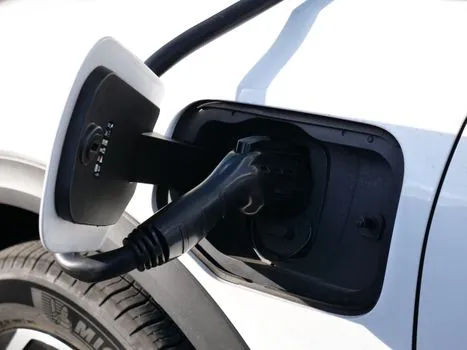
For January-April 2026, seven Chinese manufacturers held a combined 72.2% of the global EV battery market, with CATL at 40.1% and BYD at 14.2% per SNE Research as reported on 1 June 2026 [S6]. This is a sharper concentration than the 55.6% CATL+BYD pair delivered in 2025, meaning the gap between the top two and the rest of the field is widening rather than closing [S1][S6].
Inside the China block, Gotion (6.1% domestic), CALB (5.3% domestic) and EVE (5% domestic) are the only suppliers running materially above the 5% line in Q1 2026, while SVOLT's 7.6% NMC share and CALB's 5.4% NMC share are the only non-CATL NMC positions above 5% [S5]. The takeaway for spec-driven buyers: NMC capacity is effectively a CATL purchase decision, whereas LFP has at least five credible Chinese suppliers above the 5% domestic line.
Chemistry Split: NMC vs LFP, and What the Sourcing Numbers Mean
For Q1 2026, CATL's 81.6% NMC share versus 41% LFP share shows a chemistry split tilted toward higher energy-density cells, while BYD's 0% NMC and 22.6% LFP share confirm an LFP-only footprint [S5]. SVOLT (7.6% NMC, 1.1% LFP) and CALB (5.4% NMC, 5.3% LFP) are the only other manufacturers in the Q1 2026 China top ten holding both chemistries in the 5%+ range, leaving the remaining 90%+ of NMC share and 80%+ of LFP share in the hands of those four players [S5].
Operationally, that means a buyer specifying NMC for a long-range passenger EV has, in practice, a CATL-or-SVOLT choice inside China, while an LFP spec for a standard-range passenger or commercial platform can be routed through at least five qualified Chinese suppliers (CATL, BYD, Gotion, CALB, EVE) and is the more competitive tender package [S5]. For non-Chinese OEM platforms, LG Energy Solution (9.2% global, 108.8 GWh in 2025), SK On (3.7%, 44.5 GWh) and Samsung SDI (2.4%, 28.9 GWh) remain the main ex-China NMC options, with Panasonic (3.7%, 44.2 GWh in 2025) still anchored to Tesla demand [S1].
Market Sizing, Forecasts, and Where the Estimates Diverge

Grand View Research sized the global EV battery market at USD 61.31 billion in 2024 and projected a 22.2% CAGR through 2030 [S2]. Fortune Business Insights put 2025 value at USD 76.99 billion, with EV batteries commanding a 44.37% share of the broader lithium-ion segment [S4]. Persistence Market Research is more aggressive, projecting USD 213.6 billion by 2033 at a 13.9% CAGR over 2026-2033 [S7]. The 2024-to-2025 value step implied by Grand View versus Fortune is consistent with the 31.7% volume growth reported by SNE Research for 2025 [S1][S2][S4].
Growth concentration risk is real: a CATL or BYD supply disruption inside China would, on the 2025 data, remove 55.6% of global EV battery volume, and on the Q1 2026 global tracking, remove 54.3% (40.1% + 14.2%) of the running year-to-date market [S1][S6]. Buyers building second-source strategies should look first at the chemistry sub-market (NMC vs LFP) rather than the headline global rank, because the BMS specification layer and the cell supplier are coupled but not identical decisions.
Limitations and Failure Modes in the Current Rankings
The SNE Research figures measure installations (cells or packs going into EVs), not revenue, and not production, so a supplier with a large stationary-storage book, such as BYD/FinDreams, can post a smaller automotive number than its total output would suggest [S1]. China's produced-to-installed ratio at 19% in early 2026 also means official installation numbers understate underlying factory output, and the headline growth of 31.7% in 2025 is a tonnage figure rather than a margin or quality figure [S1][S5].
Inside a single chemistry, supplier concentration is even more lopsided than the global mix suggests: CATL's 81.6% Q1 2026 domestic NMC share means an OEM wanting two qualified NMC sources in China is realistically limited to CATL plus SVOLT or CALB, and an ex-China NMC dual-source strategy is realistically LG Energy Solution plus SK On or Samsung SDI [S1][S5]. Battery management and pack-level integration, where a SCADA-adjacent control layer often matters more than the cell supplier, is not visible in any market-share table, so the rankings above are a cell-supplier guide, not a system integrator guide.
Sourcing, Standards, and Trackable Signals to Watch

For procurement, the directly verifiable data points are: 2025 global installations of 1,187 GWh at +31.7% YoY; CATL 39.2%, BYD 16.4%, LG Energy Solution 9.2% as the top three [S1]; 2026 January-April global share at CATL 40.1%, BYD 14.2%, with seven Chinese firms at 72.2% combined [S6]; and Q1 2026 China chemistry splits of CATL 81.6% NMC / 41% LFP, BYD 0% NMC / 22.6% LFP [S5]. No applicable IEC or ISO standard governs market share itself, though cell-level quality programs in this industry typically reference ISO 9001 and IATF 16949 for automotive cell manufacture and UN 38.3 for transport testing.
Trackable signals over the next two quarters: the SNE Research May-2026 release for full Q2 2026 global share, the produced-to-installed ratio recovery in China (a move back above 25% would signal inventory burn-down, not a demand collapse), and any change in CATL's NMC share if a new LFP-only Chinese entrant crosses 5% domestic share. The same release pattern in the energy-storage market tracking provides the parallel stationary-storage read, which is where BYD's non-automotive volume mostly lives.
Spec-level background on the components involved: pressure transmitter, flow meter, and industrial valve.