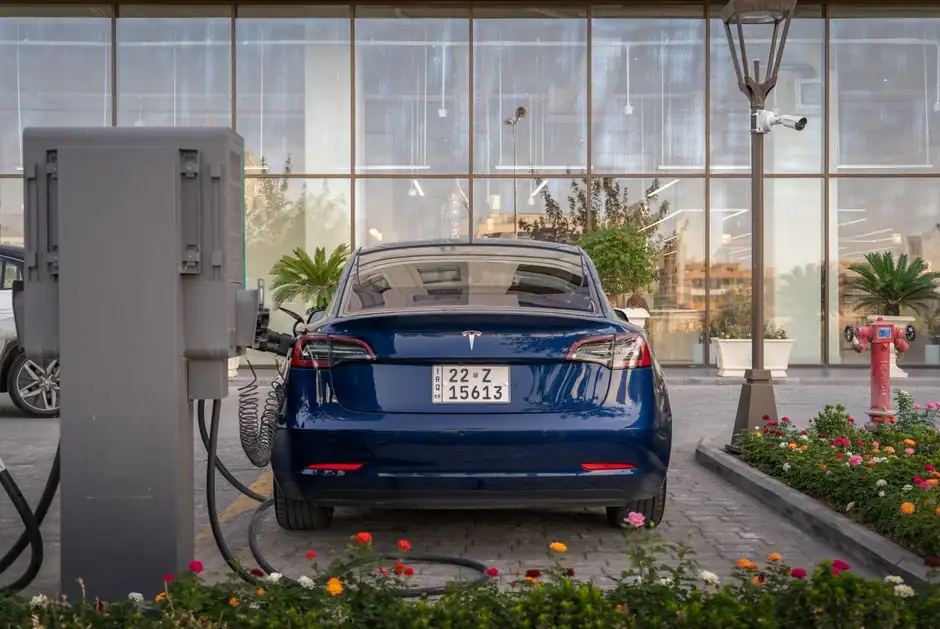
Global EV charger revenue is projected to expand from USD 22.50 billion in 2025 to a cumulative USD 82.90 billion in market opportunity over 2025-2030, a 36.2% CAGR anchored by a 44.7% APAC share of incremental growth [S1].
Residential hardware is the structural core of that build-out: Level 2 AC home chargers in the 7-19.2 kW band (NACS and J1772, TOU-optimised) are forecast to take the US residential market from USD 3.80 billion in 2025 to USD 11.20 billion by 2030 at a 24.13% CAGR, with the National Renewable Energy Laboratory (NREL) mid-case estimating 26.8 million private-access Level 1 and Level 2 ports needed by 2030 [S2].
What the 2026-2030 forecast actually counts
Forecasters disagree less on direction than on what is being counted. Technavio defines the addressable market as the sale of charging hardware (Level 1, Level 2 AC and DC fast) across residential, commercial, and fleet end-users, and reports USD 99.66 billion in historic market opportunity for 2020-2024 against a USD 82.90 billion forward opportunity for 2025-2030 [S1].
The Marqstats US-only scope strips out commercial DC fast and counts only residential hardware, which is why its 24.13% CAGR is materially below Technavio's 36.2% global figure; residential is volume-dominant in unit terms, but DC fast carries the higher dollar-per-unit value [S2]. The California Energy Commission (CEC) framing in the underlying market data is explicit: 80% of US EV charging events occur at home, with California alone accounting for 1.53 million EVs at an average electricity price of 31.97 cents/kWh (EIA 2024) [S2].
Segment mix: residential volume, fast-charger value, BEV dependency
Three structural decisions drive hardware spec for engineers: end-user (residential vs commercial), type (fast vs slow), and vehicle type (BEV vs PHEV vs HEV). Technavio's 2024 baseline puts the residential segment at USD 14.96 billion and fast chargers as the largest type by revenue, with residential accounting for over 85% of all charging sessions globally [S1].
The practical reading: AC Level 2 in the 7-19.2 kW band wins on units, while DC fast (50 kW to 350+ kW) wins on revenue per port. For BEV-pure fleets, the case for DC fast is unambiguous; for PHEV-heavy fleets (smaller batteries, lower daily kWh), a Level 2 AC mix is typically more cost-efficient. HEVs, which lack a plug, do not generate charger demand at all, so any forecast that mixes HEV volume into the charger TAM is inflating the base.
The dependence on BEV mix is direct, and the same battery-cost arc that pulls the EV bill of materials down also pulls the charger forecast up. For a deeper read on the upstream cell side, see EV battery demand 2026-2030: TWh, cell prices, and the storage crossover.
Regional splits: APAC 44.7%, US residential concentrated in California, Florida, Texas

APAC dominated the global electric vehicle charger market with a 44.7% growth share during the 2026-2030 forecast period, according to Technavio's market analysis.
Inside the US, the residential segment is geographically concentrated: California is the single largest state market (1.53 million EVs, multifamily EV charger grants, warehouse charger make-ready requirements), while Florida (334,000 EVs) and Texas (295,000 EVs) are the fastest-growing, both with active MDU battery-buffered charging programmes [S2]. The MDU access gap is the market's structural bottleneck: 44 million US households (31% of all US homes) live in multifamily housing but account for fewer than 5% of home charging events, representing the largest addressable whitespace in the US residential forecast [S2].
Comparison: AC Level 2 vs DC fast vs bidirectional on the four criteria that matter
Specifying a port mix is a four-axis decision. The table below lines the three dominant hardware classes against the criteria an engineer or fleet manager actually optimises:
AC Level 2 (7-19.2 kW, J1772/NACS): lowest cost per port (roughly USD 500-1,200 hardware), 4-8 hour full charge, residential and workplace dominant, requires minimal grid upgrade. DC fast (50-350+ kW, CCS1/NACS): highest cost per port (USD 40,000-150,000+ hardware including install), 10-30 minute charge, commercial corridor and fleet dominant, may need dedicated utility service. Bidirectional V2H/V2G (e.g. GM Energy PowerShift at 19.2 kW, Wallbox Quasar 2): premium pricing, enables vehicle-to-home and vehicle-to-grid discharge, residential pilot programmes, requires utility interconnection approval (PG&E V2E pilot, Massachusetts 100-charger V2X programme) [S2].
On grid stress, DC fast is the constraint: clustered DC fast sites can increase localized grid stress by over 50%, which forces either utility-side upgrades or, as a workaround, battery-buffered DC fast cabinets that decouple peak demand from the grid feed [S1][S2].
Standards, connectors, and the policy countdown
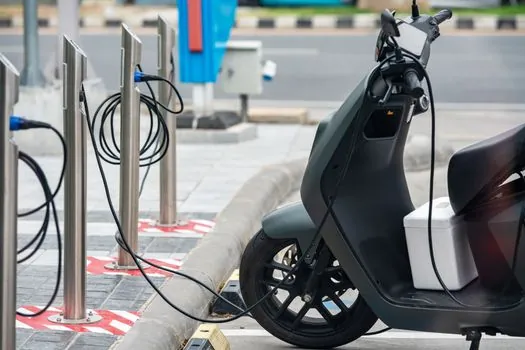
The NACS connector transition is the dominant 2024-2026 hardware-reshape event. Tesla opened the North American Charging Standard (NACS) to third parties, and Ford, GM, Rivian, and Honda have all adopted it, forcing vendors like ChargePoint (Home Flex, J1772 and NACS variants) and Leviton (plug-in EV Series Smart Home) into dual-connector product lines to span the residential hardware replacement cycle [S2].
Policy timing matters as much as connector choice. The IRS Alternative Fuel Vehicle Refueling Property Credit (30%, up to USD 1,000 per item, eligible census tracts) expires June 30, 2026, and that narrow window is producing a pull-forward installation incentive in 2025-2026 [S2]. Engineers specifying residential hardware in 2026 should assume federal tax credit is unavailable after Q2 2026 and that post-credit growth depends on natural EV adoption, utility-managed-charging programmes, and multifamily make-ready mandates.
Who this forecast is for, and where it breaks
Use this 36.2% CAGR if you are sizing a global hardware manufacturing or component supply business, where the APAC skew and the residential/fast split are the dominant signal. Use the US-only 24.13% CAGR if you are planning residential channel sales, utility programme design, or MDU retrofits, where state-level concentration in California, Florida, and Texas is the actionable signal [S1][S2].
Where the forecast is weakest: grid capacity. The 26.8 million NREL mid-case port estimate and the cumulative 2025-2030 USD 82.90 billion hardware opportunity both assume the grid can absorb the load, and that assumption is doing a lot of work. ADS-TEC's battery-buffered ChargeBox deployment at a 470-unit North Miami Beach multifamily complex (March 2024) demonstrates that grid-constraint-free MDU charging is technically viable without panel upgrades, but battery-buffered cabinets add USD 30,000-100,000+ per site and shift the bottleneck from electrical infrastructure to capital cost [S2].
Forecasting methodology: why the same numbers diverge
The 2026 Center for Sustainable Energy brief by Nicholas L. Cain, Ph.D., and Amy Lastuka, Ph.D. isolates three sources of forecast divergence that any spec-driven reader should weigh [S3]:
First, definitions vary. Some forecasts count each charging port as a "station," others count sites; some include Level 1 (120 V, 1-1.4 kW, almost no incremental cost) and others exclude it. Second, assumptions on EV adoption, battery size, and home-vs-work charging split drive large swings; the DOE's 80% home-charging event share is a behavioural assumption, not a physical one, and any shift in workplace charging economics moves the residential forecast materially. Third, conceptual models differ: a "one port per EV" model gives very different totals than a "shared-port utilization" model that assumes multi-EV households share a single Level 2 [S3].
For procurement, treat 36.2% global CAGR as an upper bound, 24.13% US-residential CAGR as the central case for that segment, and the NREL 26.8 million private-access port figure as the physical lower bound for the US alone.
For a comparable look at how the upstream battery and grid-storage economics are pulling the same demand curve, see Lithium Battery Competitive Landscape 2026: Chemistry, Capacity and Supplier Tiers.
Trackable signals for the next two quarters: the Q4 2026 IRS credit expiry data pull (June 30, 2026 deadline) on residential installation pull-forward, Massachusetts' 100-charger V2X programme deployment pace, and the NREL update to the 26.8 million private-access port mid-case for 2030.
Spec-level background on the components involved: pressure transmitter, flow meter, and industrial valve.